
Fig. 6.
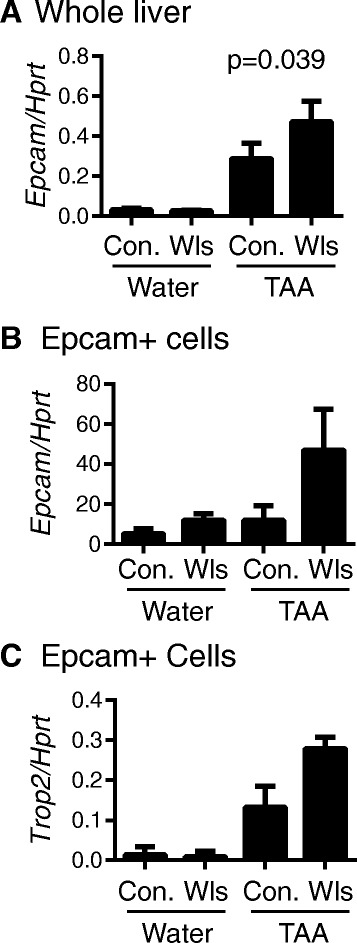
Increased Epcam expression in Epcam+ cells from LysM-Wls mice. a Whole liver expression of Epcam in water- and 12-week TAA-treated control and LysM-Wls mice (mean + SEM of 8–17 mice from 4 independent experiments). Expression of b Epcam and c Trop2 in flow cytometry-sorted Epcam+ cells (pooled from 3 to 6 mice) from water- and 12-week TAA-treated control and LysM-Wls mice (mean + range of 2 independent experiments)