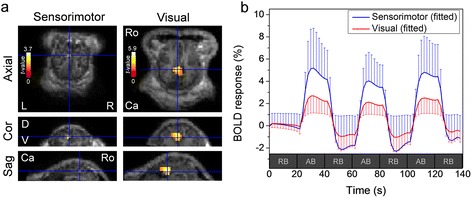
Fig. 2.

Group-processed fMRI activation maps and the time-course of BOLD signals. a Group-level fMRI activation maps from seven sheep via random-effect analysis of the sensorimotor area (P < 0.05, no voxel-based corrections) and visual area (uncorrected P < 0.01, with cluster extent threshold of 27 contiguous voxels) were overlaid on axial, coronal and sagittal anatomical MRI. Left column: via sensorimotor stimulation, Right column: via visual stimulation. L: left, R: right, D: dorsal, V: ventral, Ca: caudal, and Ro: rostral. b The time-course of BOLD responses averaged across the group of sheep (n = 7, error bars are standard deviation of the signal) from the local maxima of sensorimotor-(blue) and visual-(red) related region-of-interests (ROIs) on fMRI activation maps. RB: resting block (20 s-long), AB: activation block (20 s-long)
