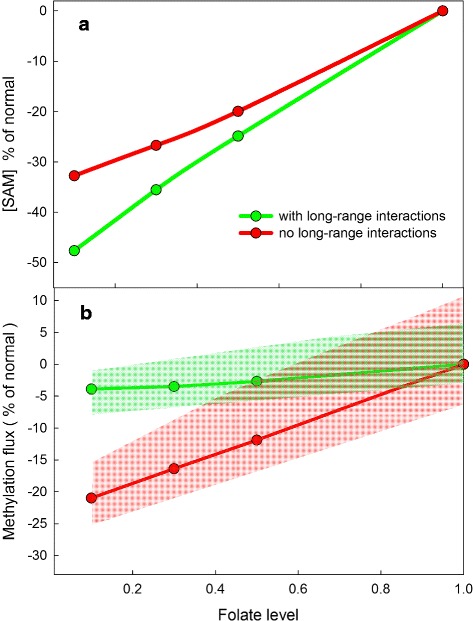
Fig. 6.

The effect of folate deficiency on total methylation. The curves in Panel a show that the SAM level is a linear function of total folate level in the liver whether the long-range interactions are present or not. This is consistent with previous studies (see text). Panel b shows that the total methylation rate (green curve) is remarkably stable as the level of total folate decreases, despite the drop in SAM, if the long-range interactions are present. If the long-range interactions are absent (red curve), the rate of total methylation decreases rapidly as total liver folate decreases. In order to show dependence on parameters, we conducted the following in silico experiments. In each experiment we multiplied the V max of each of the 11 V max values in the methionine cycle by a number drawn randomly and independently from the interval [0.9,1.1]. We then generated the green and red curves corresponding to those parameters. The shaded green and red areas show the envelopes of those curves. Although the curves depend on the choices of parameters, the main conclusion remains the same: the long-range interactions protect total methylation flux against folate deficiency
