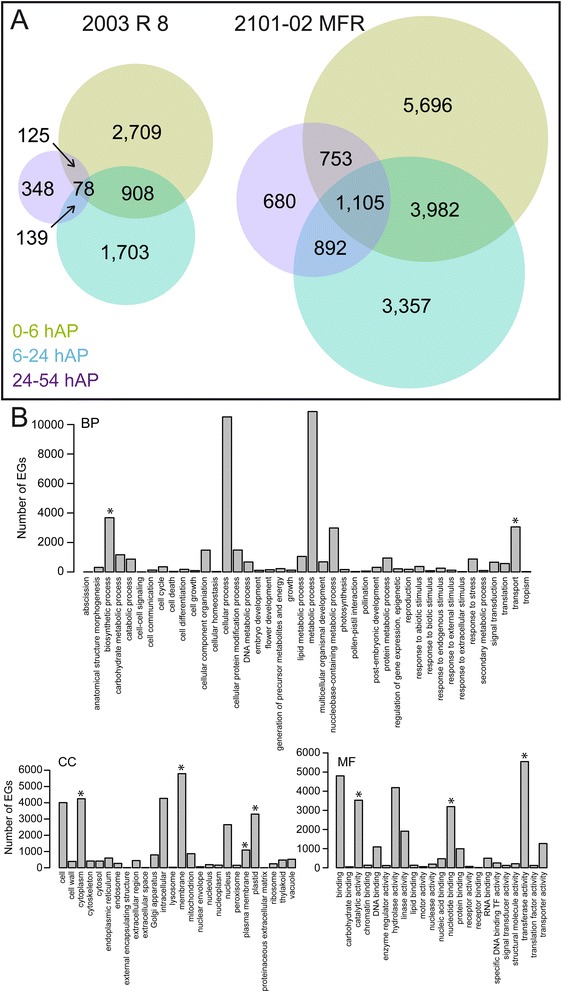
Fig. 2.

Differentially expressed genes (DEGs) over time during AR formation. a Venn diagram illustrating DEGs (P < 0.05, Benjamini-Hochberg correction) in the stem cutting base of the 2003 R 8 and 2101–02 MFR cultivars over time. b Gene ontology (GO) classification of genes whose expression changes more than 1.25 log-fold over the time-course with respect to biological process (BP), cellular component (CC) and molecular function (MF). Asterisks indicate significant enrichment of genes (P < 0.05)
