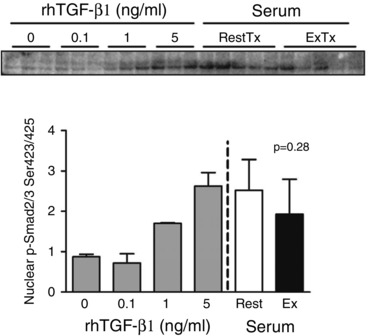
Figure 5. Nuclear Smad levels following treatment with TGF‐β1 or exercise serum .

A, nuclear abundance of phospho‐Smad2/3 in human fibroblasts after a 1 h treatment with increasing doses of recombinant TGF‐β1 or serum (10% v/v) from participants obtained at rest or 15 min after resistance exercise. P value reflects the difference between rest and exercise serum treatments. Values are means ± SD.
