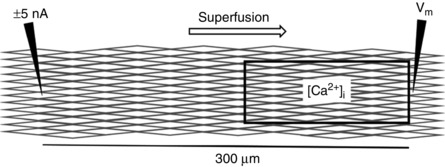
Figure 1.

Diagram of simultaneous [Ca2+]i and Vm measurements in an endothelial tube
A window 140 μm × 50 μm (encompassing ∼50 ECs) monitored [Ca2+]i using Fura‐2 dye photometry. For simultaneous measurements, the window was located adjacent to a microelectrode recording V m (right) located 300 μm from a microelectrode injecting current (−5 to +5 nA; left) to control (i.e. clamp) V m at a designated level.
