
Figure 5.
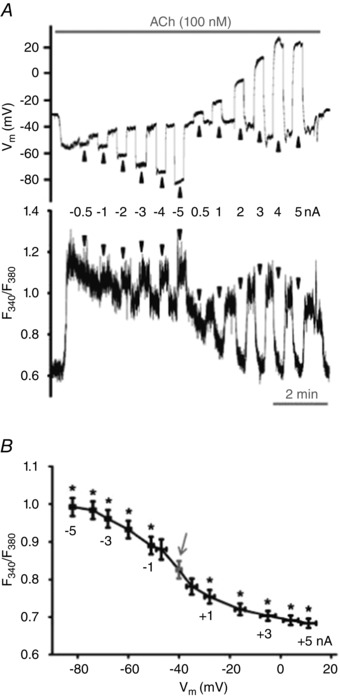
[Ca2+]i changes with Vm during stimulation with ACh
A, simultaneous V m (top) and F 340/F 380 (bottom) recordings during current injection (−5 to +5 nA; 20 s pulses at arrowheads) during 100 nm ACh. B, summary of F 340/F 380 values for corresponding values of V m at rest (arrow) and during 100 nm ACh; data binned according to level of current injection (shown near data points). This relationship is sigmoidal (R 2 = 0.974 ± 0.005) with V m at half‐maximal F 340/F 380 = −44 ± 2 mV. Note increase in F 340/F 380 with magnitude of hyperpolarization and decrease in F 340/F 380 (to baseline levels) as V m approximates 0 mV. Summary data represent n = 30 endothelial tubes from 25 mice. *P < 0.05, F 340/F 380 during current injection versus F 340/F 380 without current injection (arrow).