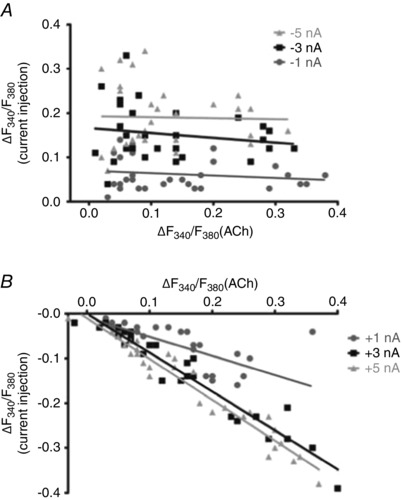
Figure 6.

Plateau [Ca2+]i responses to ACh correlate with [Ca2+]i responses to depolarization
A, scatter plot illustrating magnitude of ∆F 340/F 380 during negative current injections of −1, −3 and −5 nA during the plateau ∆F 340/F 380 response to 100 nm ACh (Y‐axis) versus the plateau ∆F 340/F 380 response (from resting baseline) to 100 nm ACh (X‐axis). Note lack of correlation (R 2 < 0.035). B, as in A during positive current injections of +1, +3 and +5 nA. Note negative correlations between the decreased [Ca2+]i during depolarization and the plateau [Ca2+]i response to ACh (R 2 > 0.55). Individual data points correspond to summary data in Fig. 5 B.
