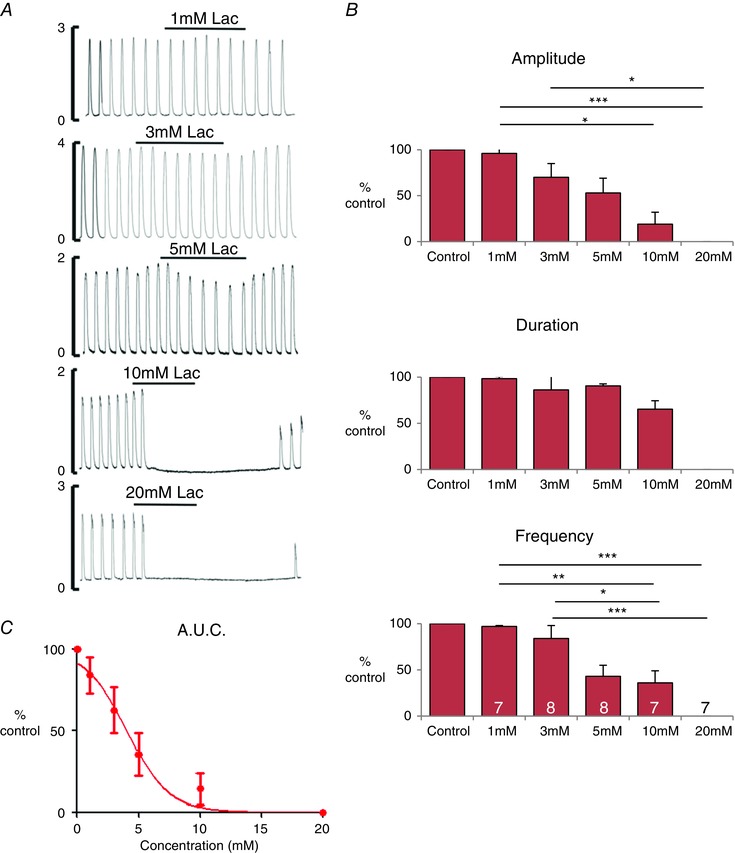
Figure 1. The effects of lactate on rat myometrium .

A, typical traces showing the effect of lactate application, from 1 to 20 mM, on spontaneously contracting myometrium. B, mean ± SEM data for contraction (i) amplitude, (ii) duration and (iii) frequency. Statistical differences tested by ANOVA are indicated by the asterisks. *P < 0.05. C, dose–response curve for contraction AUC (integral of force) and lactate concentration. Recordings were obtained at 35 °C, pH 7.4, in tissue superfused with physiological saline at 2 mL min–1.
