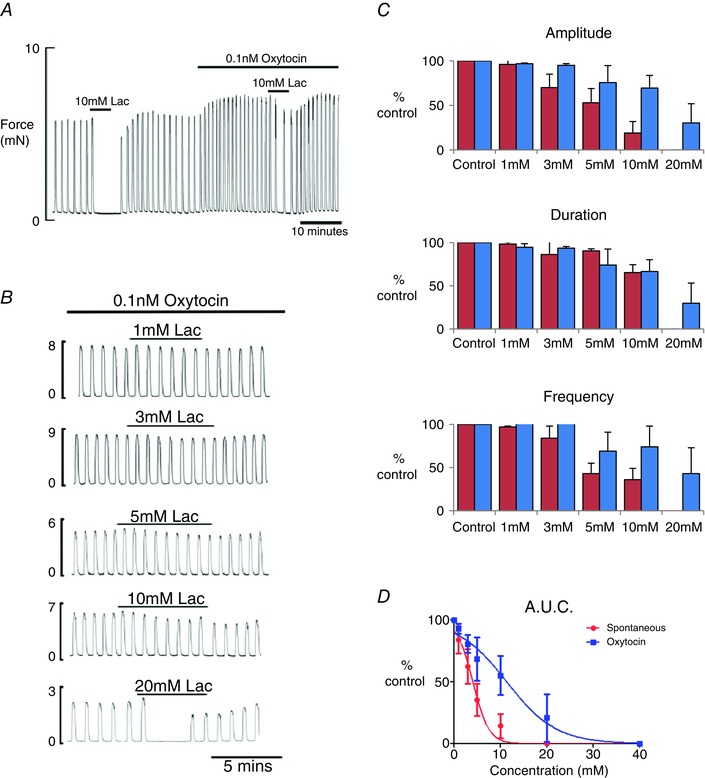
Figure 2. Effect of oxytocin on the myometrial response to lactate .

A, application of 10 mm lactate first to spontaneously contracting rat myometrium and then after stimulation with 0.1 nm oxytocin; note the greatly reduced effect of lactate in the presence of oxytocin. B, typical traces showing the effect of lactate application, from 1 to 20 mM, on oxytocin stimulated myometrium. C, mean ± SEM data showing the effects of lactate in the absence (red; data as presented in Fig. 1) and presence (blue) of oxytocin. D, dose–response curves for contraction AUC (integral of force) and lactate concentration in the absence (red) and presence (blue) of oxytocin.
