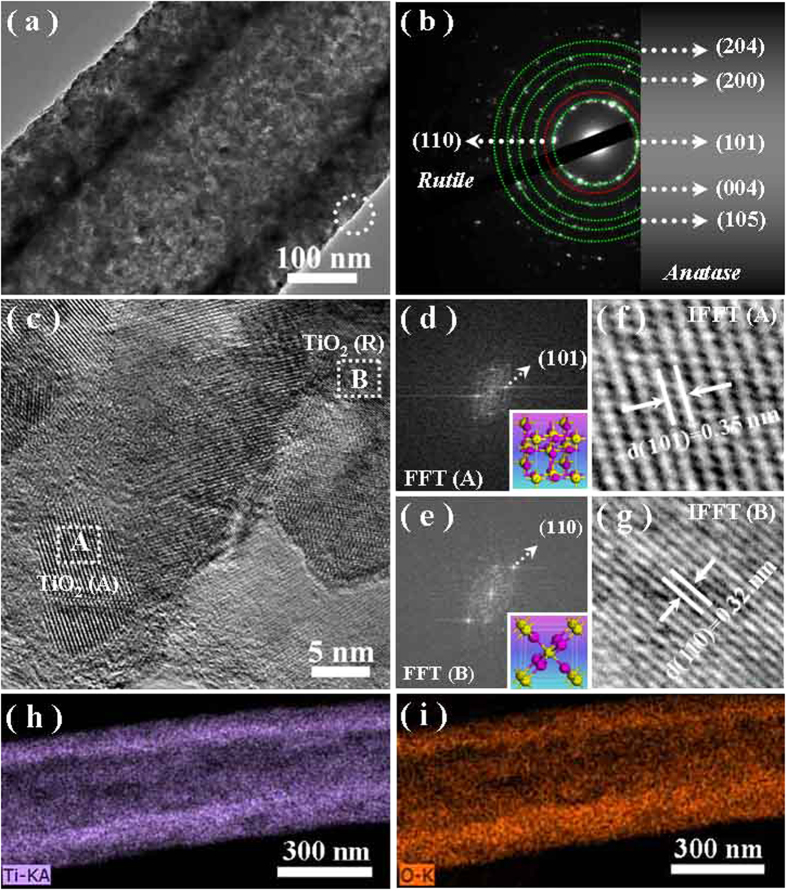
Figure 3.
(a) A representative TEM image of the mesoporous TiO2 hollow fibers. (b) The corresponding SAED pattern. (c) A representative HRTEM image of the mesoporous hollow fibers recorded from the marked area in (a). (d,e) Fast fourier transformation (FFT) images of the marked areas of A and B in (c). The insets are the partial geometry models of anatase and rutile TiO2, respectively. (f,g) The corresponding inverse fast fourier transformation (IFFT) images of (d,e), respectively. (h,i) The element mappings of Ti and O within a single nanofiber.

