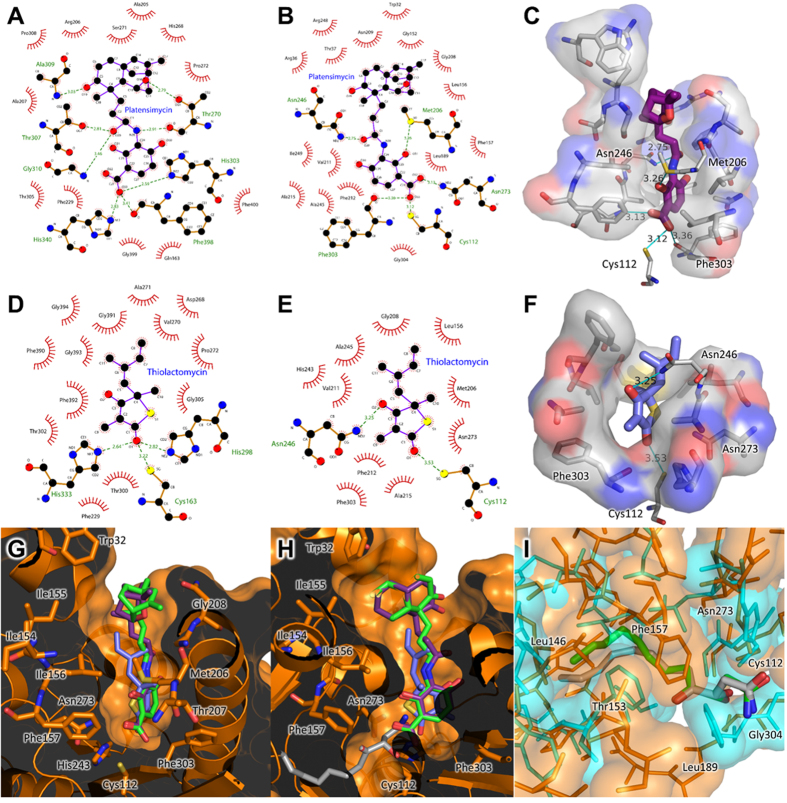
Figure 6. Comparison of interactions between known inhibitors of β-ketoacyl-acyl carrier protein synthases and Yersinia pestis FabH docked models.
2D representations of the interactions between platensimycin and E. coli FabF (A), and that of platensimycin docked to YpFabH (B), indicate substantially fewer bonds are formed between platensimycin and YpFabH compared to that of E. coli FabF (PDB:2GFX), and the non-polar residues Met206 and Gly208, which may repel the ether oxygen in the ketolide moiety of platensimycin. Hydrogen bonds are represented by green dashed lines, hydrophobic contacts are shown as red circular arcs. (C) A 3D diagram of the interactions between platensimycin and YpFabH identified in Fig. 6B, showing potential hydrogen bonds (blue lines) and hydrophobic interactions (silver clouds). 2D representations of the interactions between thiolactomycin and E. coli FabB (PDB:1FJ4) (D), and that of thiolactomycin docked to YpFabH (E), suggests the rotation of thiolactomycin to fit into the YpFabH binding pocket, and the loss of dual histidine residues in the catalytic triad reduces the number of bonds which would stabilise thiolactomycin when bound to YpFabH, compared to E. coli FabB/FabF. (F) A 3D diagram of the interactions between thiolactomycin and YpFabH identified in Fig. 6E, showing potential hydrogen bonds (blue lines) and hydrophobic interactions (silver clouds). (G) A cut-away view of the YpFabH (orange) active site surface showing residues that may interact with platencin (green), platensimycin (purple), and thiolactomycin (light blue). (H) Superposition of cerulenin (PDB:1FJ8, silver) into the active site of YpFabH suggests the active site is too small to accommodate the inhibitor, which may partially account for the poor inhibition of FabH exhibited by cerulenin. (I) Superposition of YpFabH (orange), YpFabF (cyan), and cerulenin from cerulenin bound E. coli FabB (PDB:1FJ8, silver) and FabF (PDB:1B3N, green) structures suggests that the YpFabH substrate binding pocket is shorter than that of YpFabF, at least partly due to hydrophobic residues that lie near the catalytic triad, thus any future drug design efforts should accommodate for the differences in depth between the substrate binding pockets of FabB, FabF and FabH 2D representations were generated using LigPlot+55.

