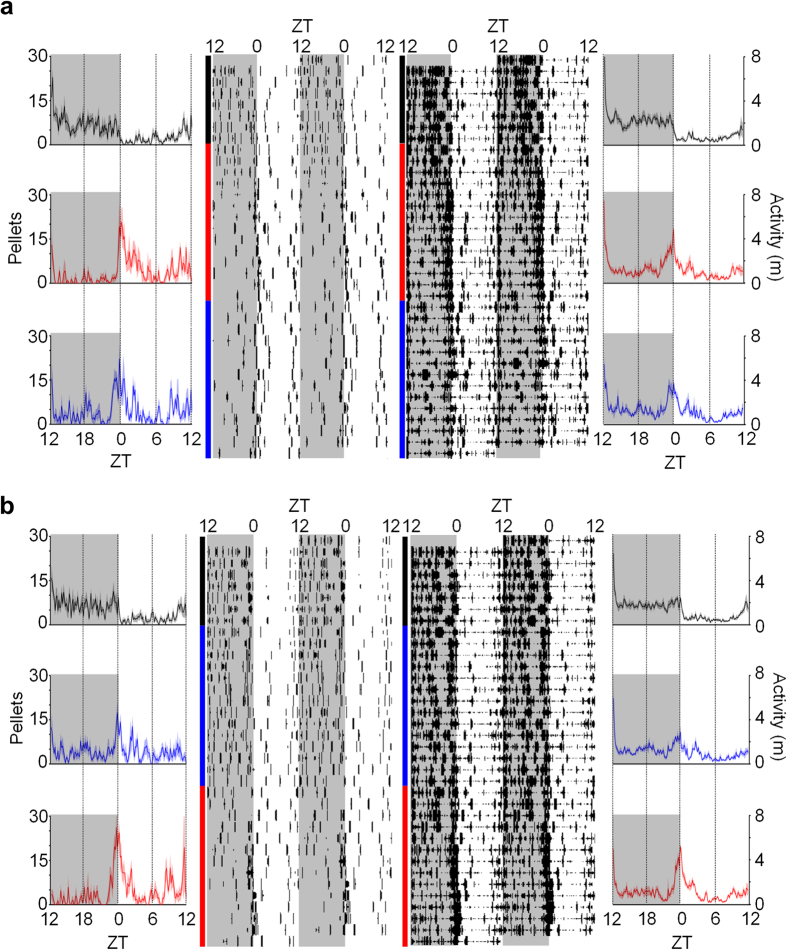
Figure 4. Effects of nocturnal shock on circadian rhythms.
24-h waveforms (outside) and raster plots (inside) of feeding (number of pellets obtained; left) and activity (distanced traveled in m; right) through baseline (black), unsignaled (red) and signaled shock (blue) conditions in rats that (a) experienced unsignaled shock first (n = 8) and (b) experienced signaled shock first (n = 8). Waveforms show mean feeding/activity over 24 h (bold lines), in 10-min time-bins, averaged over the last 5 d of each condition. Raster plots are from a representative animal from each group. Gray shaded areas (ZT12-24/0) indicate dark/shock phase. Behavior during nocturnal shock conditions increases 4 h leading up to the dark-to-light transition (ZT0). SEM is represented by shaded areas above and below the bold lines.

