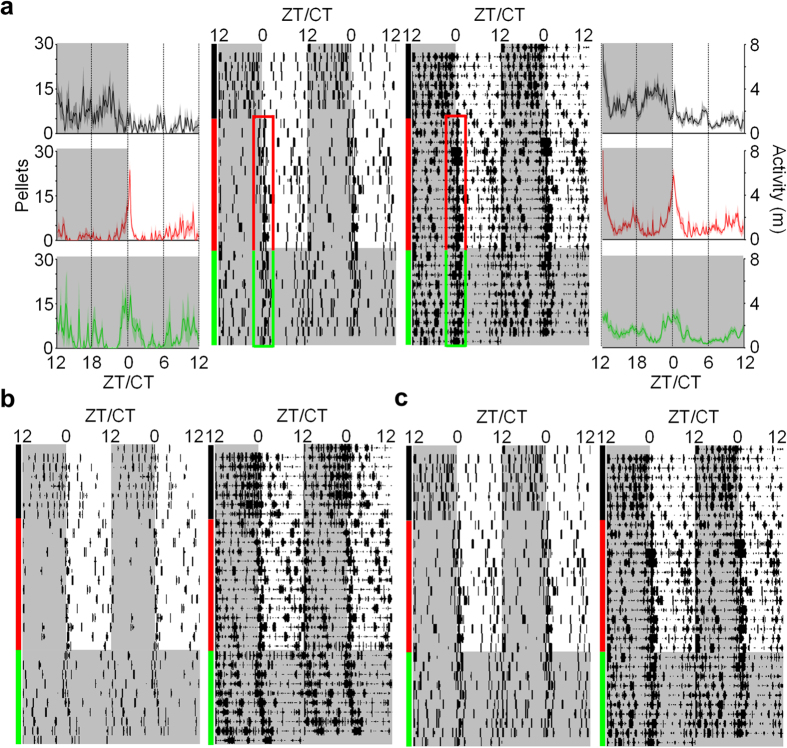
Figure 5. Fear-entrained anticipatory circadian feeding and activity.
(a) 24-h waveforms and raster plots of feeding (number of pellets obtained; left) and activity (distanced traveled in m; right) through baseline (black), unsignaled shock (red), and constant dark conditions (green) demonstrate fear-induced, anticipatory circadian rhythms. Waveforms show mean (n = 5) feeding/activity over 24 h (bold lines) averaged over the last 5 d of each condition. Mean waveforms of feeding (bottom left; n = 3) and activity (bottom right; n = 5) under constant dark conditions demonstrate free-running rhythms. Phases are aligned according to free-running onset of feeding or activity respectively. SEM is shown as the shaded areas above and below the bold lines. The raster plots are from a representative animal. The red outline highlights the anticipatory circadian rhythm generated under unsignaled nocturnal shock conditions, which continues as a free-running rhythm (green outline) under constant dark conditions. Raster plots of feeding (left) and activity (right) from representative animals with free-running periods that were (b) greater than 24 h and (c) less than 24 h. Gray shaded areas represent the dark phase. Circadian times (CT) are extrapolated from the LD cycle, with CT12 being the extrapolated time of lights off (ZT12).

