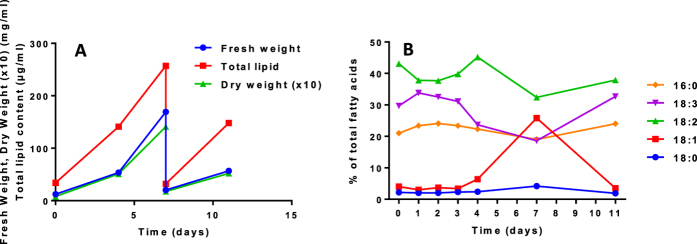
Figure 1. Fresh weight and dry weight evolutions and lipid distribution in Sycamore cells during the course of a culture cycle.

(A) representative experiment showing the fresh weight and the lipid content evolutions after the transfer of the cells in a fresh media. At day 7, an aliquot of the cell suspension was transferred in a new fresh media for a new cycle of growth. Each day, an aliquot was withdrawn for fatty acid analyses. (B) main FA distribution in Sycamore cells cultivated as shown in (A).
