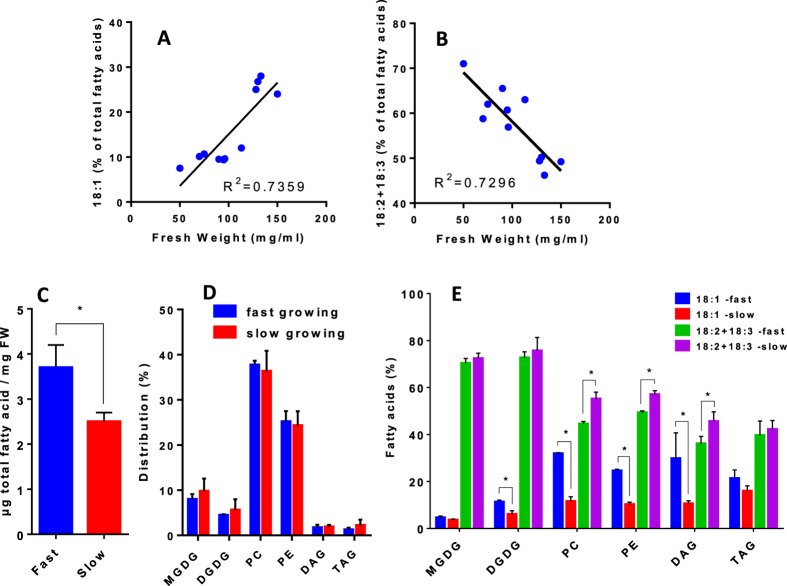
Figure 2. Correlation curves between the growth rate of Arabidopsis cells and the unsaturation levels of 18C FA species.
(A) correlation curve between the proportion of 18:1 and the fresh weight of cell suspensions measured after 3 days of culture. (B) correlation curve between the proportion of PUFAs (18:2+18:3) and the fresh weight of cell suspensions measured after 3 days of culture. The initial fresh weight at the beginning of the experiment was 30 ± 5 mg/ml for each culture. Correlation factors R2 were calculated by linear regression using GraphPad Prism software. (C) total amount of FAs in either fast or slow growing cells. (D) distribution of the main polar glycerolipids (MGDG and DGDG for main galactolipids; PC and PE for main phospholipids), and neutral lipids (DAG and TAG) in fast and slow growing cells. (E) proportion of 18:1 and PUFAs in major glycerolipids (MGDG, DGDG, PC and PE) and in neutral lipids (DAG and TAG) from either fast or slow growing cells. The data are means ± SD of three biological repeats for each condition. Statistical significant differences (P < 0.05) are shown by an asterisk and were calculated by a multiple t test using GraphPad Prism software.

