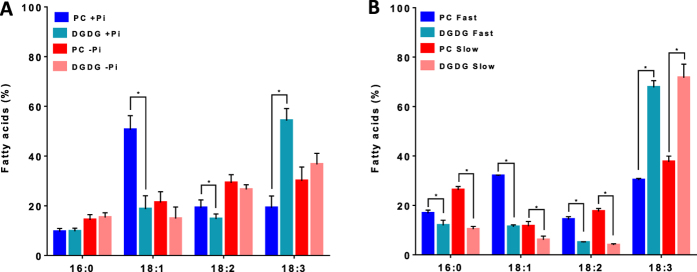
Figure 4. FA distribution in PC and DGDG.

Detail distribution of FAs of PC and DGDG in Arabidopsis calli grown with (+Pi) or without (−Pi) phosphate (A) or in Arabidopsis cell suspension cultures displaying fast or slow growing rates (B). The data are means ± SD of three biological repeats for each condition. Statistical significant differences (P < 0.05) are shown by an asterisk and were calculated by a multiple t test using GraphPad Prism software.
