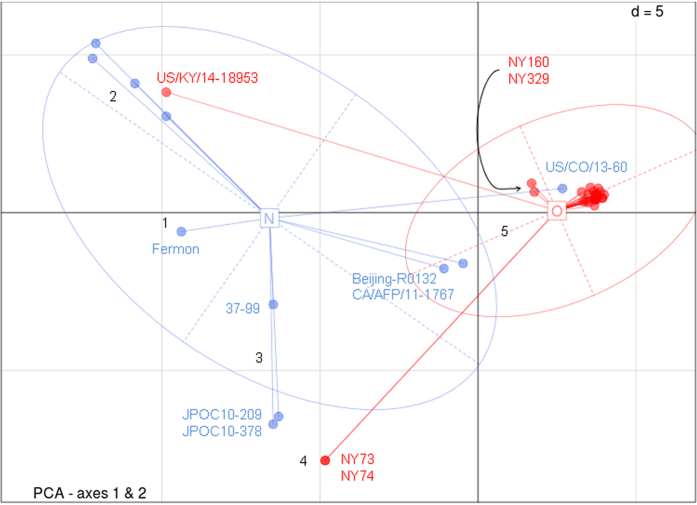
Figure 2. Scatter plots of 40 strains based on the first two principal components.
Two groups are shown by colors and ellipses, while dots represent 40 individual strains. Red: EV-D68 strains in the USA in 2014—Group O; blue: EV-D68 strains before 2014 or outside of the USA—Group N. The five main clusters are shown in numbers.

