
Figure 6.
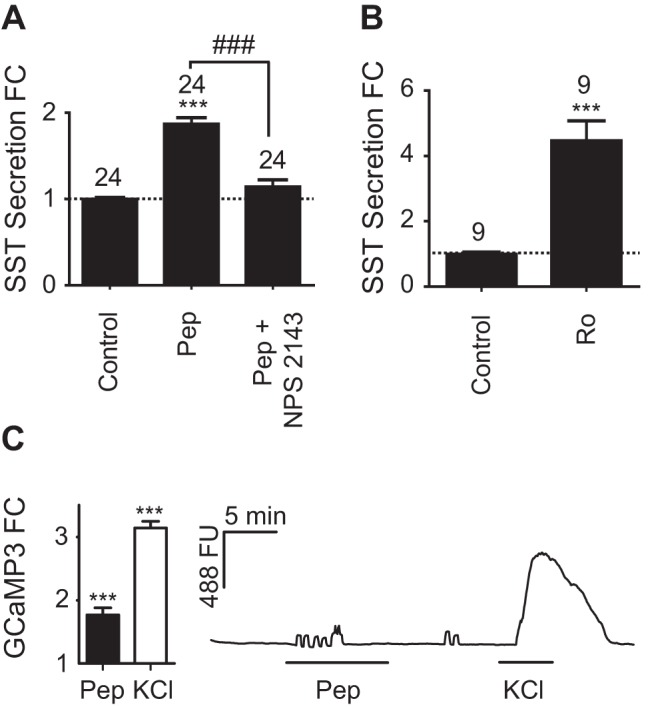
Nutrient-regulated SST secretion from primary gastric epithelial cultures. Mixed gastric epithelial cultures from the corpus and antrum were incubated for 2 hours in bath solution containing peptones (Pep) (0.5% wt/vol) with or without NPS 2143 (5 μmol/L) (A), or Ro5166017 (Ro) (50 nmol/L) (B). SST was measured in the supernatant fraction and is expressed relative to basal secretion measured in parallel on the same day (control). FC is fold change compared with control (indicated by the dashed line); n numbers for each condition are represented above each bar. Error bars represent 1 SE, and significance is shown analyzed by ANOVA with a post hoc Bonferroni modification or Student's t test, where appropriate; *** or ###, P < .001. C, Gastric epithelium from transgenic mice expressing tdRFP and the genetically encoded calcium sensor, GCaMP3, under the control of the Sst promoter was cultured for 24 hours before imaging. D-cells identified by tdRFP and GCaMP3 fluorescence were excited at 488 nm, and the GCaMP3 fluorescence (FU) was recorded (reflecting changes in [Ca2+]i). Cells were perfused with standard bath solution containing either 0.5% wt/vol Pep or 30 mmol/L KCl, as indicated. Mean changes in calcium after the addition of Pep or KCl were calculated by normalizing the peak response to the 488 fluorescence at baseline before and after the stimulus (fold change [FC]). Twelve out of 38 cells responded to Pep. Data represent the mean and SE of responding cells. Significance compared with baseline was calculated using a single Student's t test; ***, P < .001.