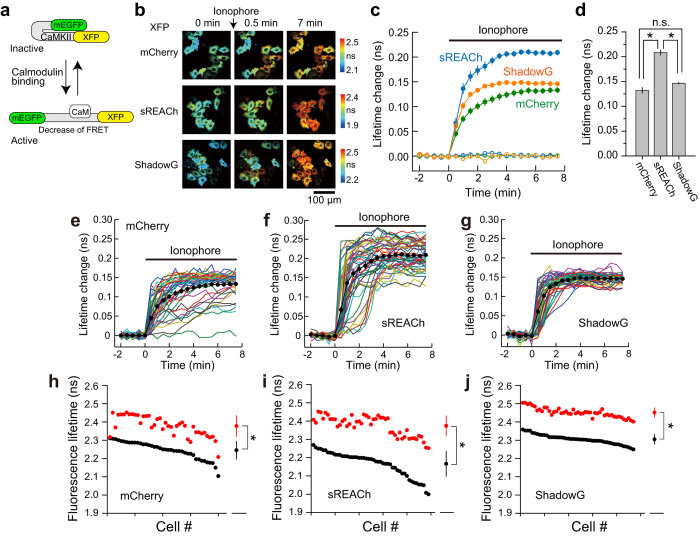
Figure 3. Performance of ShadowG in the configuration of Camuiα in HeLa cells.
(a) A schematic of activation of the Camuiα mutant (CaMKII FRET sensor; see Materials and Methods). XFP denotes mCherry, sREACh, or ShadowG. (b) Representative fluorescence lifetime images of Camuiα coexpressed with calmodulin (DNA molar ratio 1:1) in HeLa cells after stimulation with the 10 μM ionophore 4-Bromo-A23187. Two-photon excitation at 920 nm was used for the excitation of mEGFP. The scale bar is 100 μm. (c) The averaged time course of fluorescence lifetime changes in response to application of the ionophore (closed circles) or dimethyl sulfoxide (DMSO; open circles). The number of cells analyzed is 40 for mCherry, 49 for sREACh, and 47 for ShadowG. In the DMSO experiment, the number of cells analyzed is 17 for mCherry, 31 for sREACh, and 24 for ShadowG. The data are presented as mean ± SEM. (d) The fluorescence lifetime changes (averaged over 6 to 7.5 min) after ionophore stimulation. The data are presented as mean ± SEM. Asterisks denote statistical significance (p < 0.05, analysis of variance [ANOVA] followed by Scheffé’s post hoc test). (e,f) The activation of Camuiα in individual HeLa cells after stimulation with the ionophore (the same data set as in panel c). Colored lines represent the response signals from individual cells, and the black circles indicate the averaged time course. The data are presented as mean ± SEM.(h–j) The basal fluorescence lifetime (averaged over −2 to 0 min) of individual cells is plotted in the descending order (black) along with the corresponding fluorescence lifetime (averaged over 6 to 7.5 min) after stimulation with the ionophore (red). The data from (e–g) are used in (h–j), respectively. The data are also presented as mean ± SD on the right. Asterisks denote statistical significance (p < 0.05, t test).

