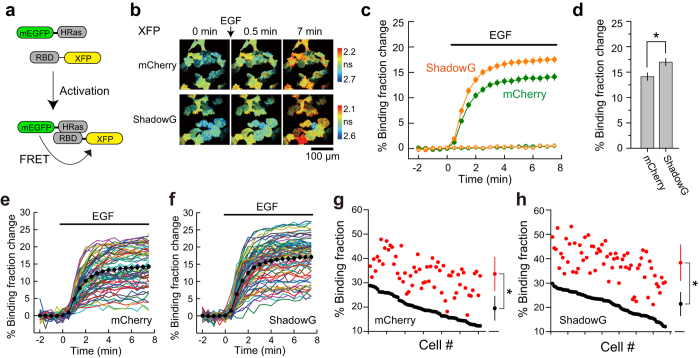
Figure 5. The performance of ShadowG in a FRET sensor of H-Ras activity in HeLa cells.
(a) A schematic of the H-Ras activation. XFP denotes mCherry or ShadowG. (b) Representative fluorescence lifetime images of mEGFP-H-Ras in HeLa cells after stimulation with 50 nM EGF. Two-photon excitation at 920 nm was used for the excitation of mEGFP. The scale bar is 100 μm. (c) An averaged time course of fluorescence lifetime changes in response to stimulation with EGF (closed circles) or with empty buffer (open circles; control). Cells showing a 10–30% basal binding fraction (before stimulation) were chosen for the analysis. The number of cells analyzed is 66 for mCherry and 61 for ShadowG. In the control, the number of cells analyzed is 66 for mCherry and 68 for ShadowG. The data are presented as mean ± SEM. (d) The fluorescence lifetime changes (averaged over 6 to 7.5 min) after stimulation with EGF. The data are presented as mean ± SEM. Asterisks denote statistical significance (p < 0.05, t test). (e,f) The activation of H-Ras in individual HeLa cells after stimulation with EGF (the same data set as in panel c). Colored lines represent the response signals from individual cells, and the black circles indicate the averaged time course. The data are presented as mean ± SEM. (g,h) The basal fluorescence lifetime (averaged over −2 to 0 min) of individual cells is plotted in the descending order (black) along with the corresponding fluorescence lifetime (averaged over 6 to 7.5 min) after stimulation with EGF (red). The data from (e,f) are used in (g,h), respectively. The data are also presented as mean ± SD on the right. Asterisks denote statistical significance (p < 0.05, t test).

