
Figure 6. Dual observation of H-Ras activation and ERK2 translocation into nucleus.
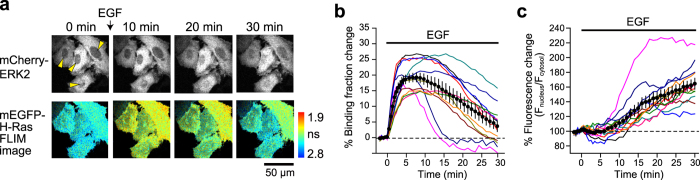
(a) Representative fluorescence lifetime images of mEGFP-H-Ras and mCherry-ERK2 fluorescence images after stimulation with 50 nM EGF. HeLa cells were transfected with RBD-ShadowG-P2A-mEGFP-H-Ras, mCherry-ERK2, and MEK1. We used 2-photon excitation (980 nm) of mEGFP and mCherry. Yellow arrowheads indicate the nuclei of individual cells. The scale bar is 50 μm. (b) Activation of H-Ras in individual HeLa cells after stimulation with EGF. Colored lines represent the response signals from individual cells, and the black circles indicate an averaged time course. The data are presented as mean ± SEM. (c) The time course of translocation of mCherry-ERK2 into the nucleus. The fluorescence intensity in the nucleus was divided by that in the cytosol and plotted in the graph. Colored lines represent the response signals from individual cells, and the black circles indicate the averaged time course. The data are presented as mean ± SEM.