Figure.
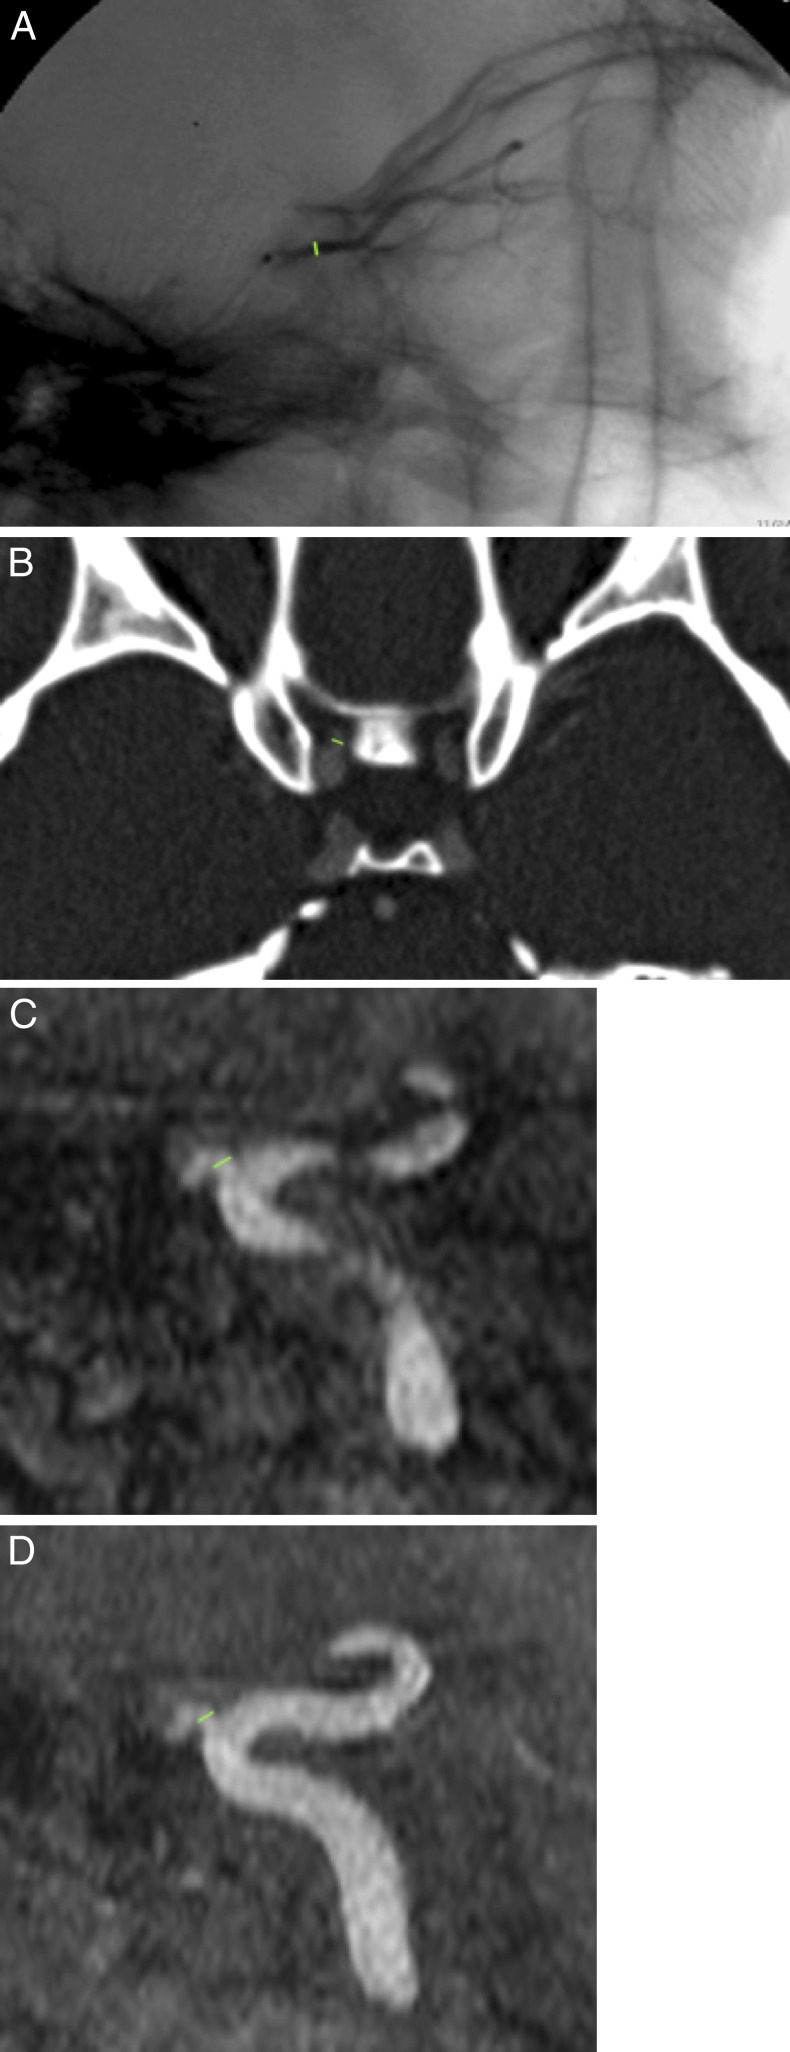
Lateral image of a super-selective angiogram of a NHP OA (A), with a measurement between the level of the ophthalmic origin and the orbital apex. Axial CT angiographic image showing a measurement of the OA diameter shortly after the origin (B). A sagittal reformat of an MR angiogram (C) as well as a sagittal maximum-intensity projection of the same MR angiogram (D) demonstrating the location of the measurement.

