
Figure 11. Venn diagram of sRNAs differentially affecting biofilm formation and related phenotypes.
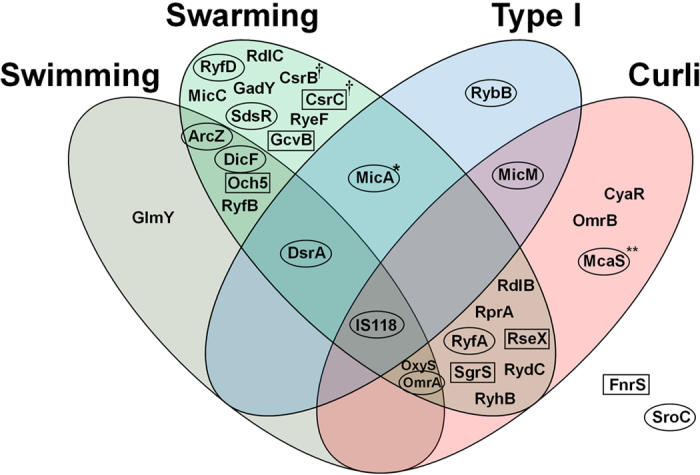
sRNAs that increase and decrease biofilm formation >1.5-fold are shown in boxes and ellipses, respectively. All sRNAs except for MicA and McaS in the Venn diagram inhibit one or more biofilm-related phenotypes. MicA that increases swimming motility >1.5-fold is marked ‘*’, McaS that increases swarming motility >1.5-fold ‘**’, and CsrB and CsrC that generate more reddish color on Congo red plates ‘†’. FnrS and SroC shown outside the Venn diagram affected biofilm formation positively and negatively, respectively, without affecting the biofilm-related phenotypes.