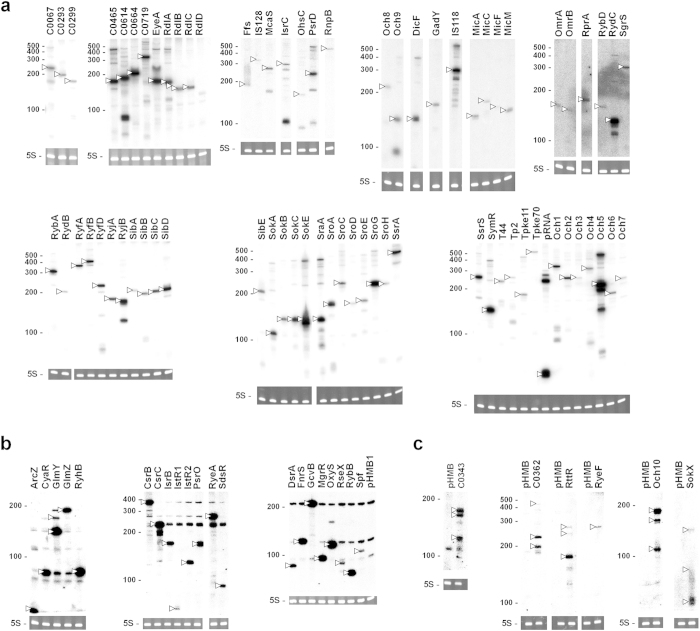
Figure 2. Northern blot analysis of overexpressed sRNAs. MG1655 cells containing each sRNA-expressing plasmid were grown to OD600 ~ 0.6, and induced with 1.0 mM IPTG for 20 min.
Total RNAs (10 μg) were subjected to northern blot. Membranes were probed with rnpBXb1 (a), specific oligonucleotide mixes (b), or each specific oligonucleotide (c). RNA sizes were estimated using Century marker (Ambion), indicated on the left. 5S rRNA stained with ethidium bromide was also used as a loading control. Overexpressed sRNAs are marked by arrowheads.

