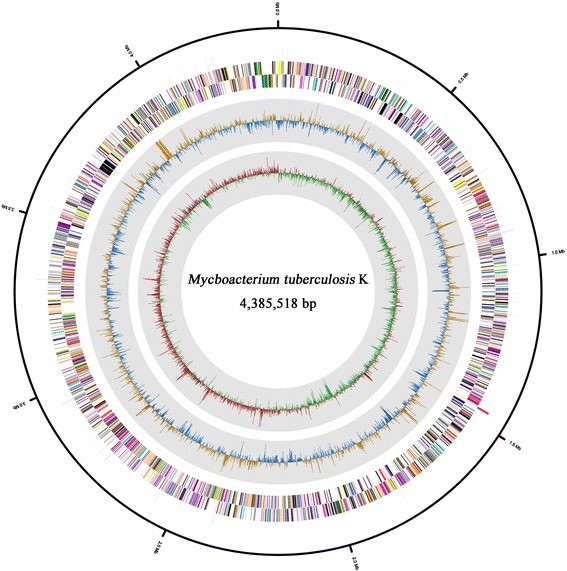
Fig. 4.

Graphical circular map of M. tuberculosis K strain genome. From the outside to the center: RNA features (ribosomal RNAs are colored as blue, and transfer RNAs are colored as red), genes on the forward strand and the reverse strand (colored according to the COG categories). The inner two circles show the GC ratio and GC skew. The GC ratio and GC skew are shown in orange and red indicates positive, and in blue and green indicates negative, respectively
