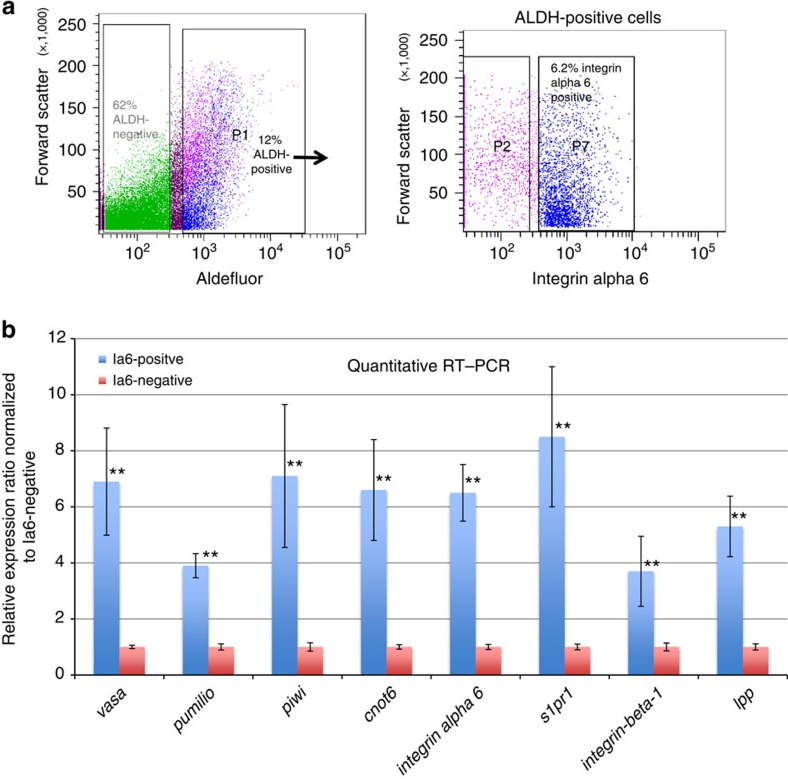
Figure 2. Prospective isolation of germ cell precursors based on expression of aldehyde dehydrogenase and integrin alpha-6 gene expression analysis.
a) Representative example of fluorescence-activated cell sorting (n=20). Aldehyde dehydrogenase (ALDH)-positive and -negative cells were gated based on Aldefluor-fluorescence compared with unstained controls, and 12% of total cells are ADLH-positive. From the ALDH-positive population (arrow), integrin alpha-6-positive (p7) and -negative cells (p2) were gated based on isotype control staining. 6.2% of total cells are ALDH-positive/integrin alpha-6-positve. (b) Q-RT-PCR analysis of integrin alpha-6-(Ia6)-positive or -negative cells sorted from the ALDH-positive population. Relative quantification was performed using the 2-ΔΔCT-method, with ef1α as control gene. Data are expressed as averages of the relative expression ratio (fold change), normalized to Ia6-negative cells. Standard deviations were calculated for each average expression ratio (n=3). Statistical analysis was performed using Student's t-test. **P≤0.05 (medium significance compared with Ia6-negative cells).

