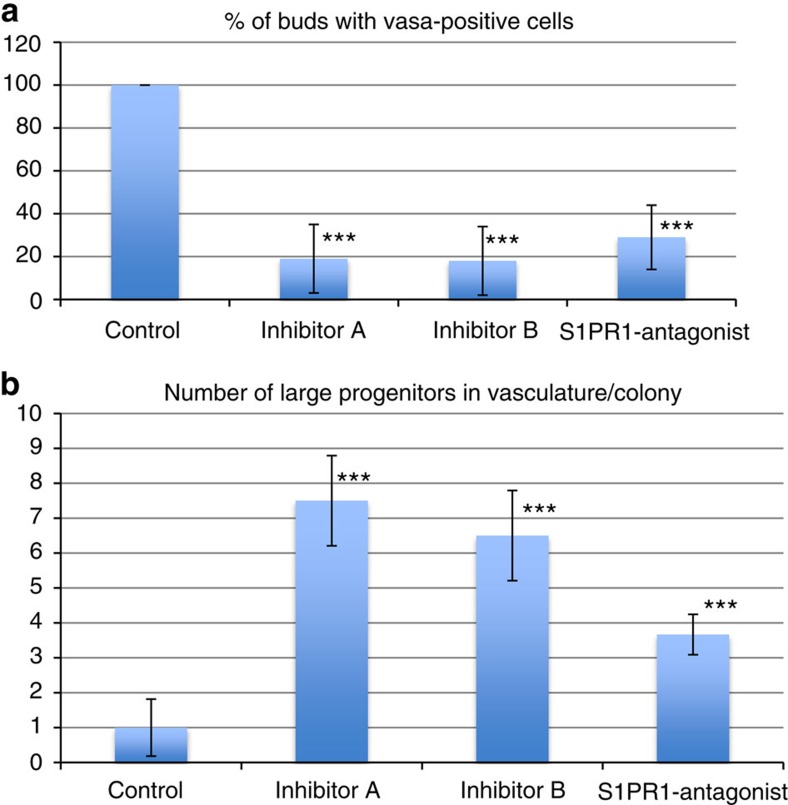
Figure 6. Quantification of migration defects in animals treated with inhibitors of S1P signalling.
(a) The number of double-vesicle-stage secondary buds containing vasa-positive were counted for each condition. Data are expressed as average percentages of buds containing vasa-positive cells, normalized to untreated controls. (b) The number of large (>20 μm) vasa-positive cells in the vasculature of the colony was counted for each condition. Data are expressed as average number of large vasa-positive cells per colony, normalized to untreated controls. Error bars represent the standard deviation for each average (n=4). Statistical analysis was performed using Student's t-test. ***P≤0.01 (high significance compared with control).

