Fig. 4.

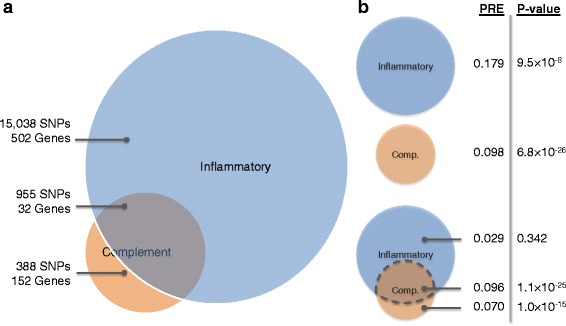
Overlap between complement and inflammatory pathways. a Venn diagram of SNP and gene overlap between the complement and inflammatory pathways. b P-values and the proportion of risk explained (PRE) by complement and inflammatory pathways, separately and for overlapping regions. Overlapping SNPs were determined using regions including genic SNPs plus 50 kb flanking regions
