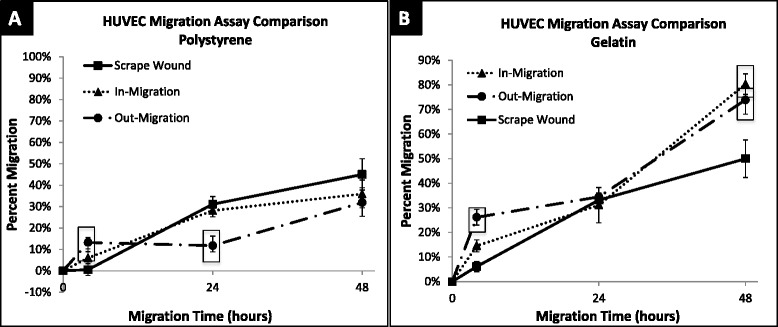
Fig. 10.

Percent migration of HUVEC across 48 h on polystyrene and gelatin. a HUVEC migration on polystyrene surface at 4, 24 and 48 h; shown in percent migration when compared to baseline migration at 0 h. Out-migration and in-migration were significantly higher than scrape wound migration at 4 h, (p < 0.0001 and p = 0.0183). Out-migration was significantly lower than scrape wound migration at 24 h (p = 0.0014). b HUVEC migration on gelatin surface at 4, 24 and 48 h; shown in percent migration when compared to baseline migration at 0 h. In-migration significantly larger than scrape wound migration at 0 (p = 0.0075) and 48 (p = 0.0014) hours. Out-migration significantly larger than scrape wound migration at 0 (p < 0.0001) and 48 (p = 0.0106) hours. ☐ symbol outline indicates statistical significance (p-values < 0.05). Values shown as mean ± standard error
