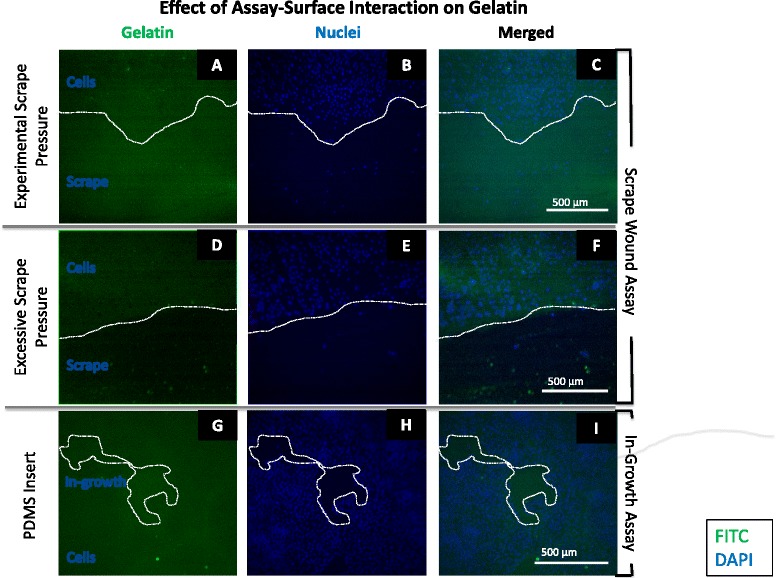
Fig. 12.

Image table of SMC migration on gelatin-FITC after 24 h. a-c Images depict wound edge of scrape wound assay at experimental scrape pressure on gelatin-FITC-coated surface. d-f Images depict wound edge of scrape wound assay at excessive scrape pressure on gelatin-FITC-coated surface. g-i Images depict cell in-growth area at experimental PDMS insert pressure on gelatin-FITC-coated surface. White dashed line outlines current wound edge. White scale bar (lower right in each row) represents 500 μm. Gelatin (green); SMC Nuclei (blue)
