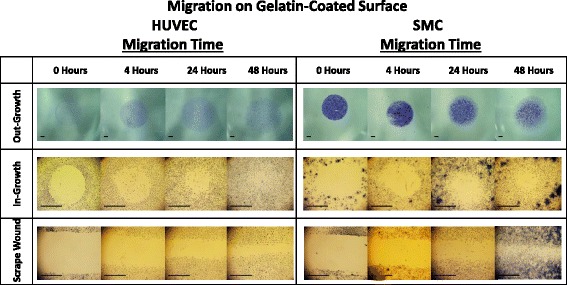
Fig. 7.

Image table of migrating HUVEC and SMC. Images depict increasing cell area as cells migrate after 0, 4, 24, and 48 h (left to right). Migration is shown on a gelatin surface for the out-growth assay (top row), in-growth assay (middle row) and scrape wound assay (bottom row). Black scale bar (lower left) in each image represents 1 mm
