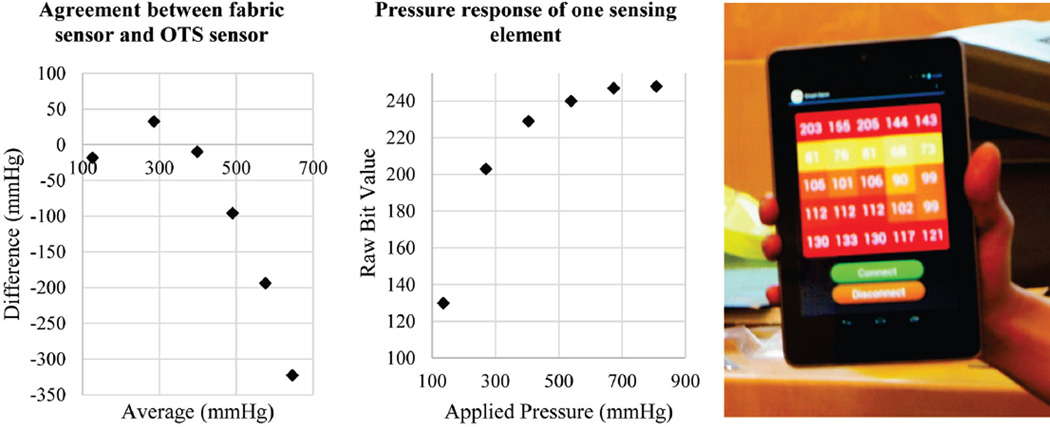
Figure 3.
Left: A Bland-Altman plot showing agreement of fabric sensor to a commercial sensor. Middle: Extended pressure response of a single sensing element showing limitations in dynamic range. Raw bit values from measurement range from 0–255. Right: Measurement output when the fabric sensor is placed on a cushioned chair and a human sits on the sensor. Raw bit values on each square represent pressure values from the sensor.

