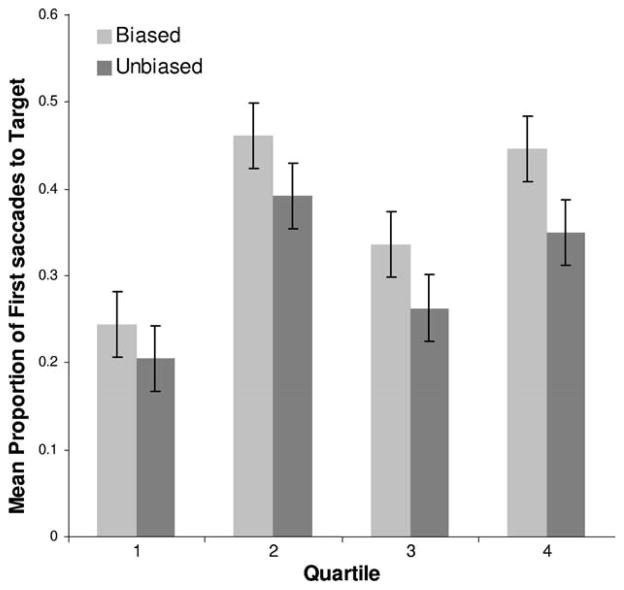
Figure 2.
Proportion of first saccades to the target for the biased and unbiased sides across all four quartiles of Experiment 2. The display size in the first two quartiles was 6° and in the third and fourth quartiles it was 10°. Error bars represent 95% confidence intervals. Note that these are the conditional proportions calculated for the biased and unbiased sides separately.

