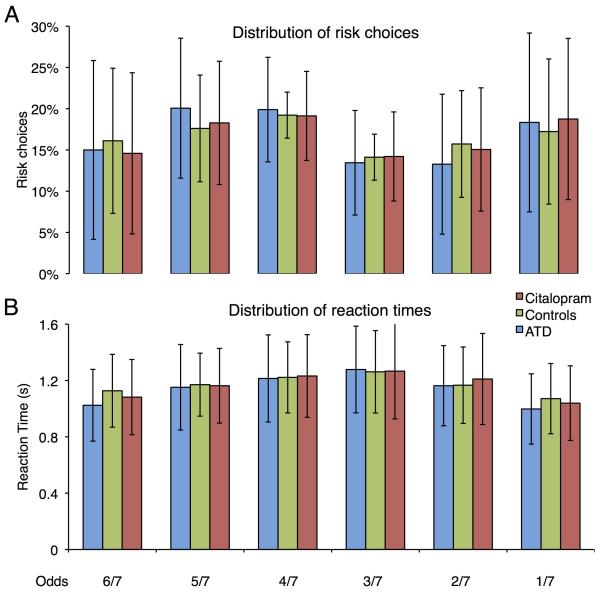
Figure 2. Choice behavior.
(A) Distribution of choices across the six risk levels (odds). We found no significant change in risk distribution due to pharmacological challenges. (B) Distribution of reaction times across the six risk levels. There were no significant differences in reaction times between the risk choices, or the serotonergic challenges. The columns represent the group mean and error bars give the standard deviation from the mean (n = 22).

