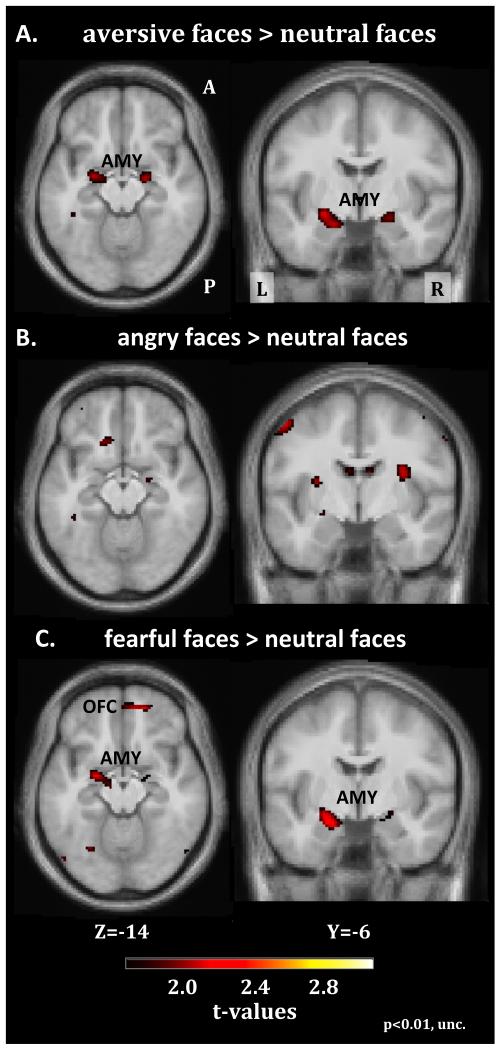
Figure 4.
Statistical parametric maps (SPMs) showing brain regions, which show a decrease in activation for aversive face expressions relative to neutral faces in the ketanserin session as opposed to baseline (control session). The SPMs are color coded in green and blue indicating decreases in BOLD signal and are thresholded at p<0.001 (uncorrected). The upper left panel depicts decreases in regional responsiveness to aversive (angry, fearful) faces under ketanserin treatment (A). The middle and lower panel on the left present the corresponding SPMs for angry (B) and fearful (C) faces. The bar graphs plot the statistical estimates (arbitrary units) of face related activity levels in the amygdala and fusiform gyrus for the control session (baseline) and ketanserin session (D). The parameter estimates are taken from the regional maxima showing the strongest decrease in the regional response to aversive faces relative to neutral faces. The error bars equal the 90% confidence intervals of the mean.

