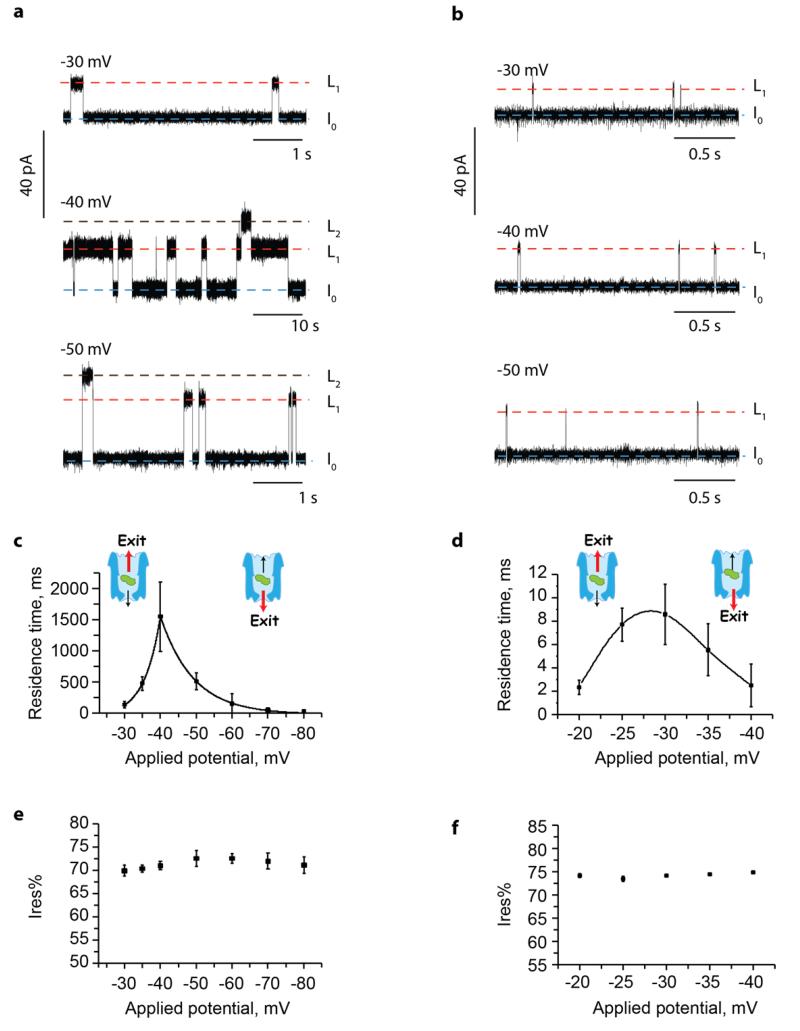
Figure 2. DHFRST blockades to Type I ClyA-AS and Type II ClyA-CS.
a,b, Typical current blockades induced by DHFRST (~100 nM, added in cis) to Type I ClyA-AS (a) and Type II ClyA-CS (b) nanopores at various negative applied potentials. The open-pore current IO is indicated by a blue dashed line. L1 and L2 current levels are indicated by red and black dashed lines, respectively. c,d, Voltage dependencies of the DHFRST blockade dwell times for Type I ClyA-AS (c) and Type II ClyA-CS (d) nanopores. The fitted lines are an exponential fit for Type I ClyA-AS and a spline trend line for Type II ClyA-CS. A likely explanation to the data is that at applied potentials lower than the dwell time maximum proteins preferentially exit the nanopore from the cis entrance, while at potentials higher than the dwell time maximum proteins exit the nanopore from the narrower trans exit. The red arrow in the molecular schemes indicates the preferred direction of protein exit. e,f, Voltage dependencies of the Ires% values of the DHFRST blockades for Type I ClyA-AS (e) and Type II ClyA-CS (f) nanopores. All current traces were collected in 150 mM NaCl, 15 mM Tris HCl pH 7.5, at 28°C, by applying a Bessel-low pass filter with a 2 kHz cut-off and sampled at 10 kHz. Errors are shown as standard deviations.

