Figure 4.

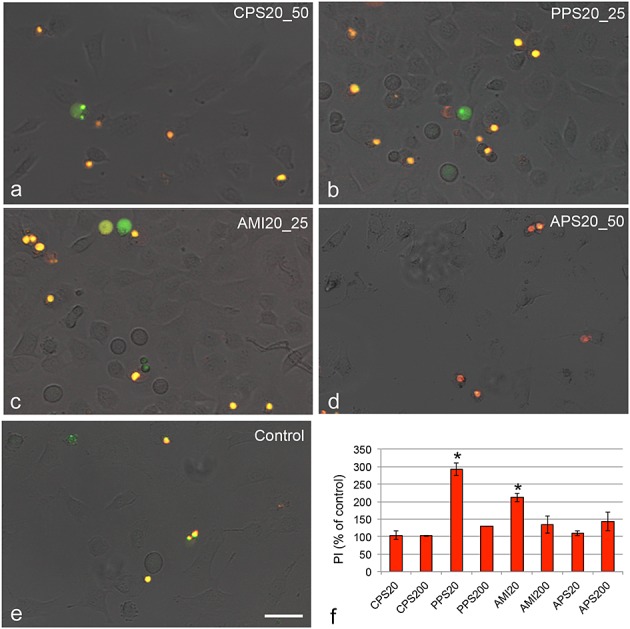
Images of EAhy 926 cells exposed for 24 h to polystyrene particles and stained with YoPro1 (green) as marker for apoptotic cells and PI (red) as marker for necrotic cells. Secondary apoptotic cells show yellow staining. Images were taken at concentrations of the most prominent effects; 25 µg ml−1 PPS20 (PPS20_25), AMI20 (AMI20_25) and 50 µg ml−1 CPS20 and APS20 particles (CPS20_50; APS20_50) compared to medium as negative control. Quantification of PI staining by fluorometric reading (f) shows staining at the respective concentrations of the 20 nm particles and at 50 µg ml−1 of the 200 nm particles. Means ± SD of three independent experiments are shown. Significant changes (P < 0.05) compared to the control cells set, as 100%, are marked by asterisk. Scale bar: 20 µm. PI, propidium iodide.
