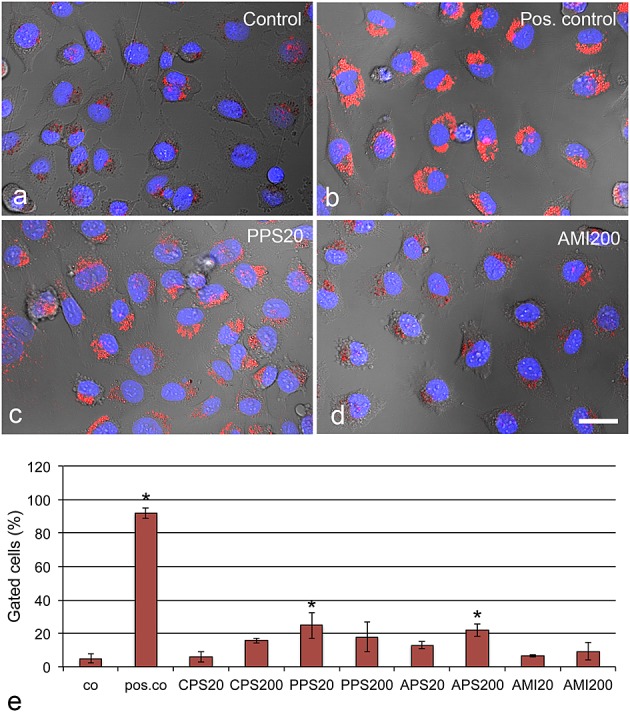
Figure 5.

Identification of lysosomal damage caused by 10 µg ml−1 polystyrene particles after 24 h, assessed by LysoD (red) staining. Different levels of lysosomal damage are seen in PPS20 (high staining, c) and AMI200 (lower staining, d) particles. Chloroquine serves as positive control (pos. co). Quantification of cellular staining by TissueFAXS software (e) shows lysosomal damage mainly by exposure to PPS20 and AMI200 particles. Means ± SD of three independent experiments are shown. Significant changes (P < 0.05) compared to control cells (co) are indicated by asterisk. Scale bar: 20 µm.
