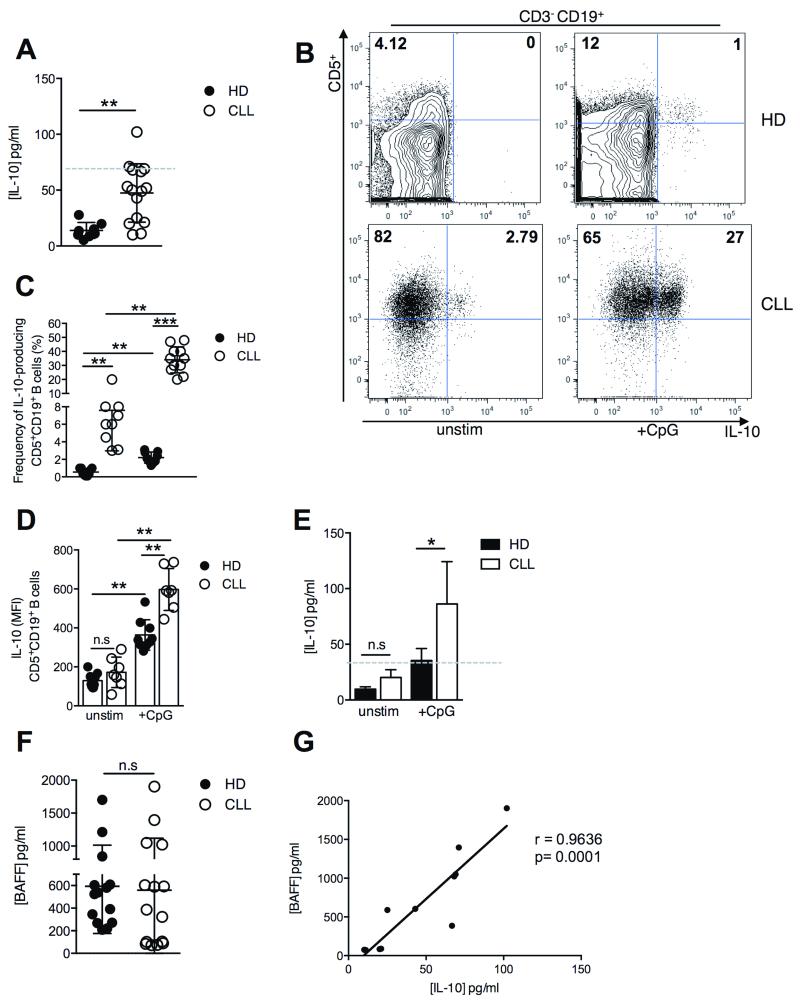
Figure 2. Analysis of BAFF and IL-10 production by CD5+CD19+ B cells from the peripheral blood of HD and CLL patients.
(A) Serum IL-10 levels for HD (n=8) and patients with progressive CLL (n=15) were measured by ELISA. (B) B10 cells from peripheral blood were gated by flow cytometry as CD3− CD5+ CD19+ CD20+ IL-10+ as indicated in representative dot plots. (C) Percentages of gated IL-10-expressing B cells in HD (n=9) and CLL (n=11) (D) CD5+CD19+ B cells isolated from the peripheral blood of HD (n= 8) and patients with progressive CLL (n=7) were stimulated with CpG and assessed for intracellular IL-10 expression by flow cytometry and (D) IL-10 secretion by ELISA (n=8 and n=15, respectively). (E) Serum BAFF levels for HD (n=14) and CLL patients (n=15) were measured by ELISA. (F) Correlation between serum levels of BAFF and IL-10 in CLL patients (n=11). In A-E, horizontal bars indicate the mean. In A-F, data are representative of at least two independent experiments.

