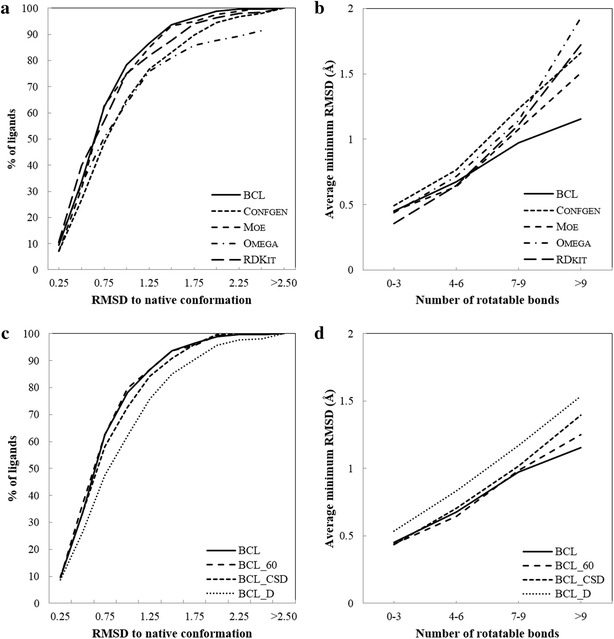
Fig. 5.

Benchmarking results for the Vernalis dataset. a The plot represents percentage of ligands (y-axis) for which different methods produce at least one conformer within an RMSD value less or equal to the RMSD value on the x-axis. b Quality of conformations sampled as the number of rotatable bonds increases. The average RMSD of conformers closest to native structure is plotted on the y-axis as the number of rotatable bonds increases (x-axis). c Same as a for different rotamer libraries used. “BCL” refers to recovery using 30° dihedral bins with rotamers derived from both the CSD and PDB. “BCL_CSD” leverages conformations from the CSD only. “BCL_D” refers to experiments in which instead of fragments containing multiple torsion angles, statistics on single dihedral angles were used for sampling conformations. “BCL_60” refers to a rotamer library that uses 60° dihedral bins are. d Quality of conformations sampled as the number of rotatable bonds increases for BCL, BCL_CSD, BCL_D, and BCL_60
