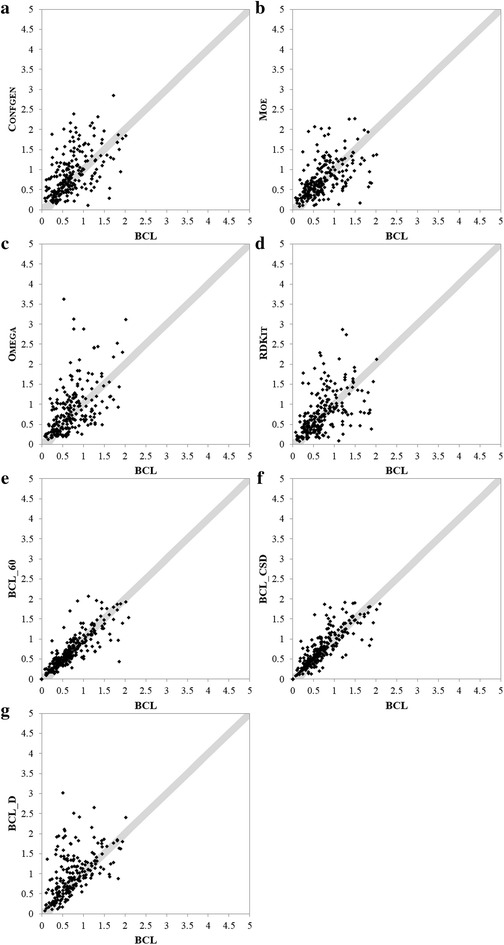
Fig. 6.

Pair-wise comparison of BCL::Conf to other methods. a–g Plot the RMSD to native for the BCL on the x-axis, for other methods or flavors of the BCL on the y-axis. BCL::Conf samples closer to native conformations for points that lie above the diagonal. Conformations plotted within the shaded region differ by less than 0.25 Å
