
Figure 1.
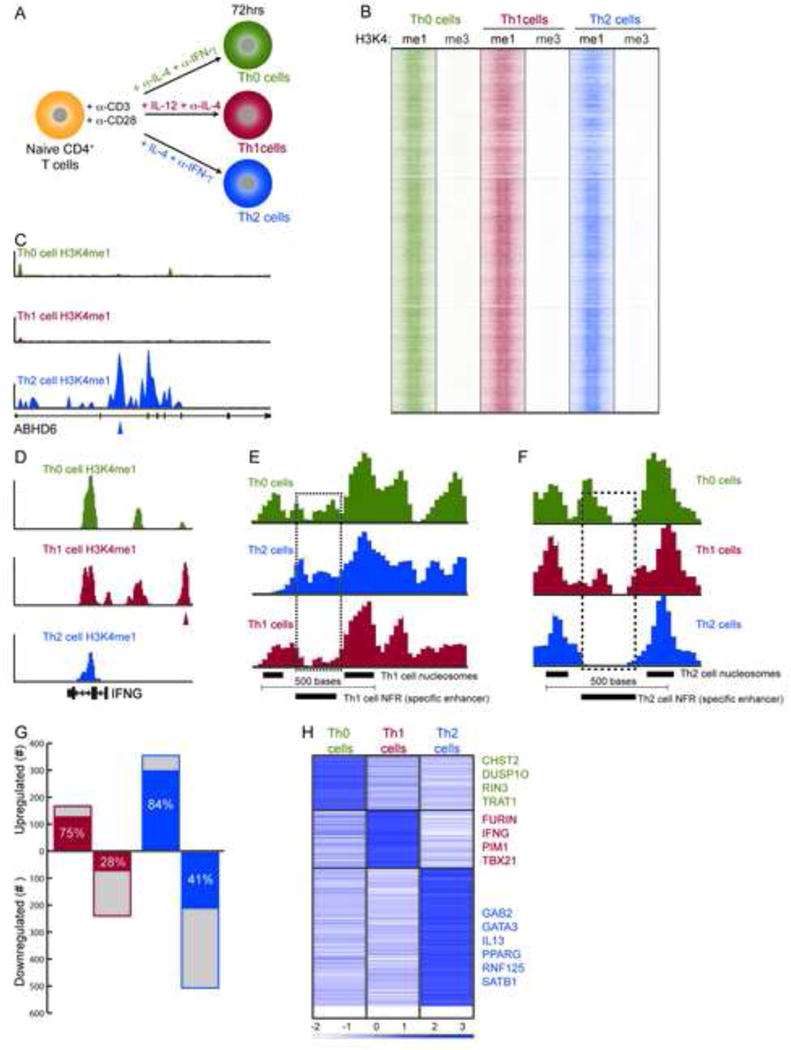
Genome-wide Mapping and Identification of Lineage-specific Enhancer Elements. (A) Illustration of experimental design for activating the cells (Th0) and for polarising cells to Th1 and Th2 cell subsets. (B) Global clustering of all predicted enhancers in Th0, Th1 or Th2 cells based on H3K4me1. H3K4me3 (promoter modification) is shown as a control. (C and D) ABHD6 and IFNG loci showing Th2- and Th1 cell-specific enhancer peaks identified through H3K4me1 predictions. (E and F) Example of lineage-specific nucleosome free regions (NFR) shown in high density plots for (E) a distal Th1 cell-specific enhancer predicted ~9kb downstream of IL10 and (F) Th2 cell-specific enhancer in an intron of BCAR3. The lineage-specific enhancer is determined by nucleosome spacing and overlapping nucleosome in the other two cell types (dashed rectangle). (G) Differential gene expression is shown for Th1 and Th2 cells relative to Th0 cells (total genes: blue + gray). Lineage-specific expression relative to Th0 cells and the other lineage (Th1 or Th2 cells) is shown in red for Th1 cells and blue bars for Th2 cells. (H) Lineage-specific differential expression relative to Thp cells to accommodate a three-way comparison.