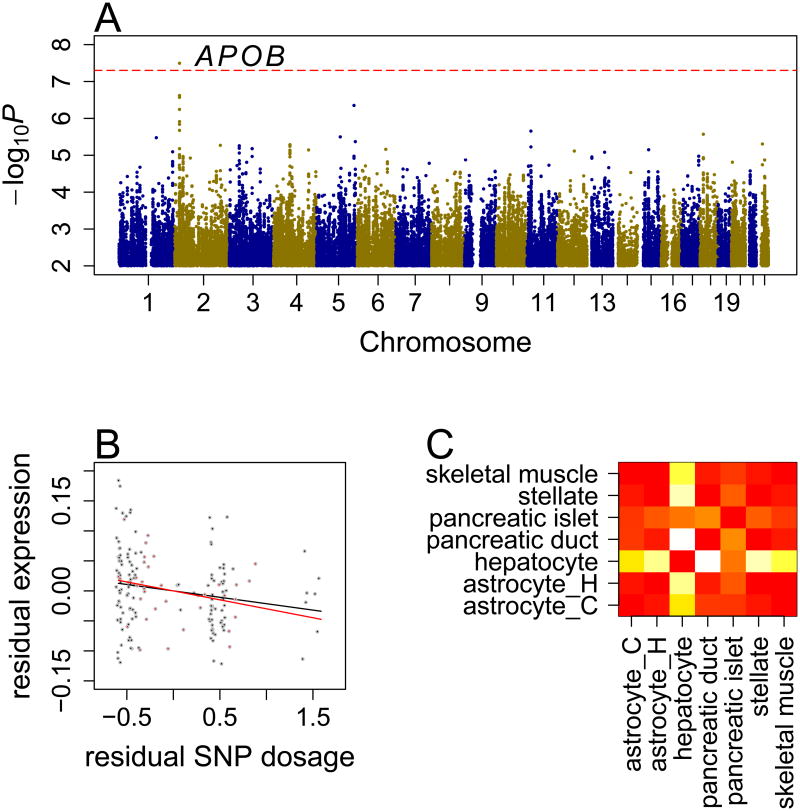
Figure 2.
Genetic association of diabetes in SCD. (A) Manhattan plot of GWAS scan. The dashed horizontal line represents the significance threshold. (B) Association between the C allele of rs59014890 and APOB gene expression in UIC (black points) and Howard (red points) cohorts. Residual expression and residual allele dosage values, after adjusting for age, gender, HBB genotype, hydroxyurea treatment and population stratification, are plotted. (C) Heatmap of −log10P from pair-wise comparison for enrichment of DNase hypersensitivity peaks within LD block of rs59014890. astrocyte_C: astrocytes-cerebellar; astrocyte_H: astrocytes-hippocampal; hypatocyte: primary hepatocytes; pancreatic duct: pancreatic duct cells immortalized with E6E7 gene of HPV; pancretic islet: dedifferentiated human pancreatic islets; stellate: hepatic stellate cells; skeletal muscle: skeletal muscle cells.

