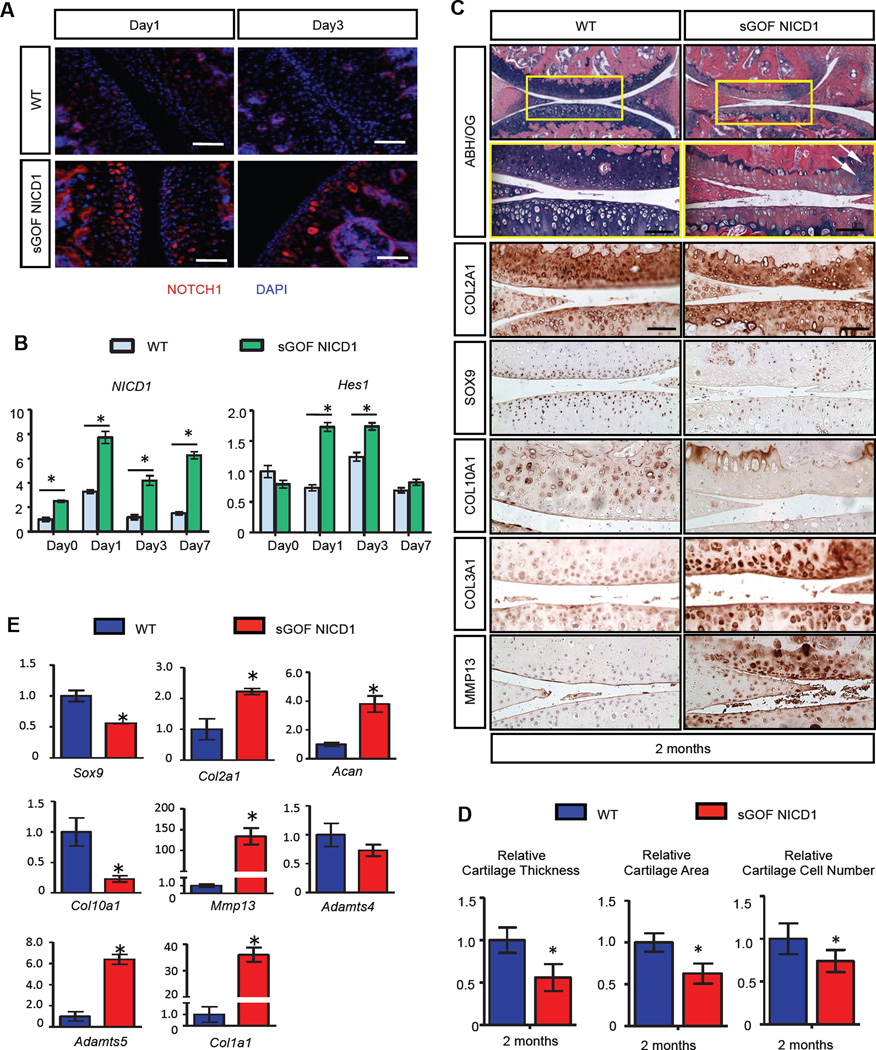
Figure 1. Sustained activation of NOTCH1 signaling in postnatal chondrocytes results in a progressive OA-like pathology.
(A) IF and (B) real-time qPCR analyses revealed sustained Notch signaling activation after high dose (100 µg/g body weight) of DOX administration. (Scale bars, 50µm.) Gene expression analyses were performed for NICD1 and Hes1 in triplicate. All samples were normalized to Beta-actin and then normalized to the controls. Bars represent means ± SD. “*” denotes P<0.05, two-tailed Student’s t test. (C) ABH/OG staining and IHC analyses of COL2A1, SOX9, COL10A1, COL3A1 and MMP13 on 2-month-old WT and sGOF NICD1 mutant knee sections. High magnification of a centralized domain of articular cartilage is shown in a yellow box. White arrows indicate cell clusters. (Scale bars, 50µm) (D) Histomorphometry analyses of articular cartilage thickness, area, and chondrocyte number performed on 2-month-old WT and sGOF NICD1 mutant knee sections. All results were normalized to WT control. Bars represent means ± SD. “*” denotes P<0.05, two-tailed Student’s t test. (E) Real-time qPCR comparing gene expression in the articular chondrocytes isolated from 2-month-old WT and sGOF NICD1 mutant mice. Gene expression analyses were performed for Sox9, Col2a1, Acan, Col10a1, Mmp13, Adamts4, Adamts5, and Col1a1 in triplicate. All samples were normalized to Beta-actin and then normalized to the controls. Bars represent means ± SD. “*” denotes P<0.05, two-tailed Student’s t test. n>3 biological repeats for all experiments.

