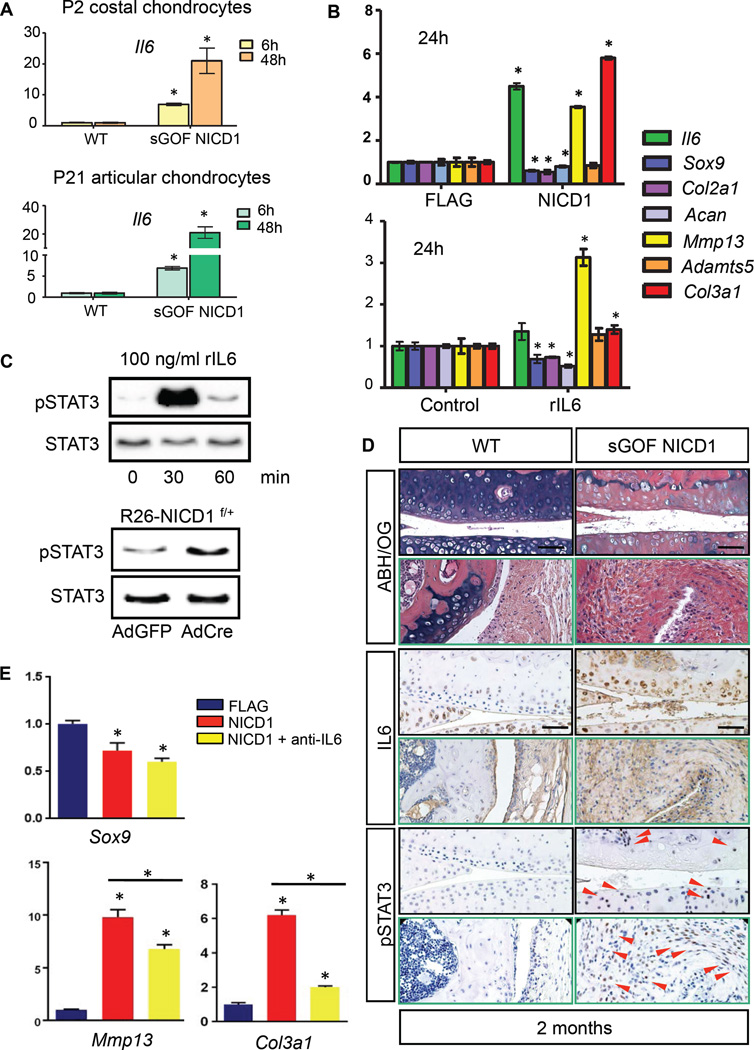
Figure 4. Sustained NOTCH1 signaling activates the IL6/STAT3 pathway in cultured cells and OA cartilages.
(A) Real-time qPCR analyses for Il6 were performed on RNA collected from P2 costal chondrocyte cultures or P21 articular chondrocyte cultures isolated from WT and sGOF NICD1 mutant pups treated with 10µg/ml DOX for 6 or 48 hours in triplicate. All samples were normalized to Beta-actin and then normalized to the controls. Bars represent means ± SD. “*” denotes P<0.05, two-tailed Student’s t test. (B) Real-time qPCR comparing gene expression in ATDC5 cells transfected with FLAG control or NICD1 over-expression vectors for 24 hours, and gene expression in ATDC5 cells treated with control diluents or recombinant IL6 proteins (rIL6, 1ng/ml) for 24 hours. Gene expression analyses were performed for Il6, Sox9, Col2a1, Acan, Mmp13, Adamts5, and Col3a1 in triplicate. All samples were normalized to Beta-actin and then normalized to the controls. Bars represent means ± SD. “*” denotes P<0.05, two-tailed Student’s t test. (C) Western blot analyses for STAT3 and phosphorylated STAT3 (pSTAT3) in proteins extracted from ATDC5 cells treated with rIL6 (100 ng/ml) for 0, 30, and 60 min, and in proteins extracted from control AdGFP infected or AdCre infected R26-NICD1f/+ primary chondrocytes. Results are representative of three independent experiments. (D) ABH/OG and IHC analyses of IL6 and pSTAT3 on 2-month-old WT and sGOF NICD1 mutant knee sections. (Scale bars, 50µm.) Red arrowheads indicate pSTAT3 positive cells. (E) Real-time qPCR comparing gene expression in ATDC5 cells transfected with FLAG control, NICD1 over-expression vectors, and NICD1 over-expression vectors plus IL6 neutralizing antibody (anti-IL6) for 24 hours. Gene expression analyses were performed for Sox9, Mmp13, and Col3a1 in triplicate. All samples were normalized to Beta-actin and then normalized to the controls. Bars represent means ± SD. “*” denotes P<0.05, one-way ANOVA, followed by Bonferroni method.

