
Fig. 4.
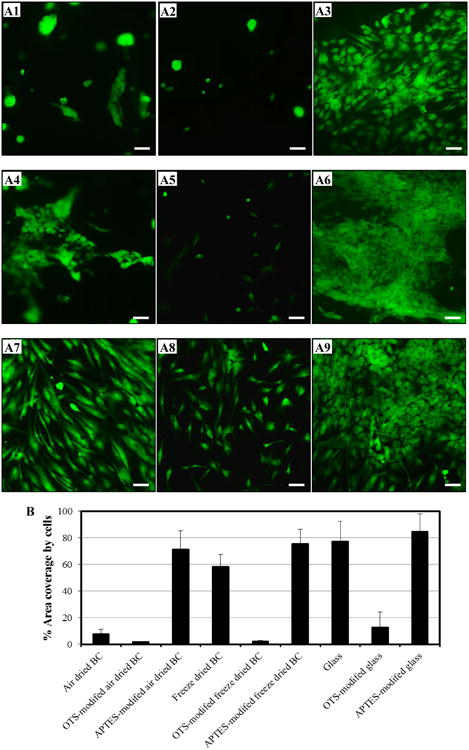
Representative fluorescence micrographs of attached and spread NHDF cells cultured on air dried BC (A1-A3), freeze dried BC (A4-A6), and glass slide (A7-A9). The incubation of NHDF cells was carried out on unmodified (A1, A4, and A7), OTS-modified (A2, A5, and A8), and APTES-modified (A3, A6, and A9) samples for 48h. Live NHDF cells (green) on the culture area of ∼8×8 mm2 were stained and captured using an Olympus IX70 microscope with 10× objective lens (the scale bar in each image is 100 μm). Visualized images were analyzed to obtained % area coverage by cells on the prepared surfaces (B) using color rage mode. 12 images from random locations of each sample were quantified. Results express as mean ± SD.