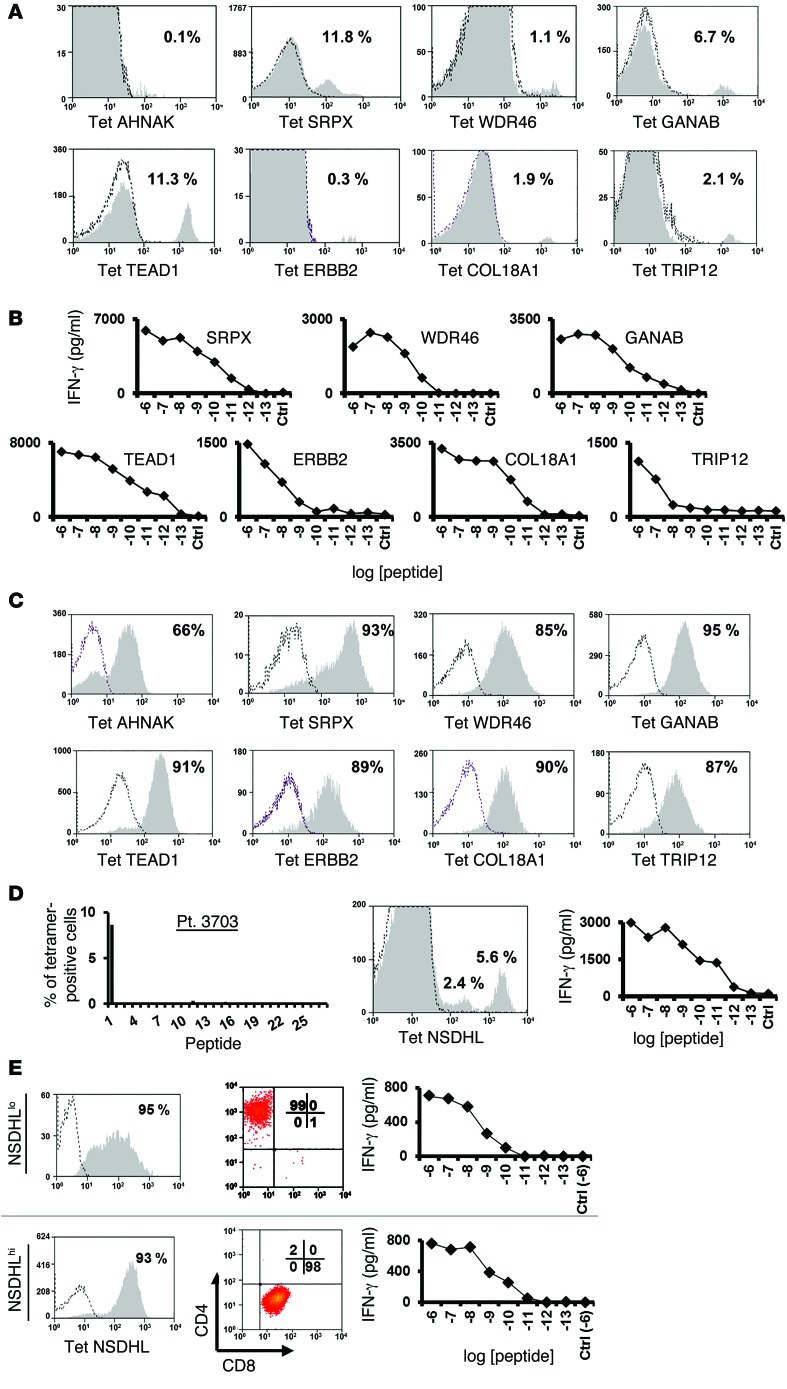
Figure 3. Treatment TILs recognize mutated antigens.
(A) Bulk-treatment TIL cultures were stained with the indicated tetramer and analyzed by flow cytometry. (B) TILs were cocultured with T2 cells pulsed with the indicated mutated epitope at different concentrations (ranging from 10–6 to 10–13 M) or cocultured with T2 cells pulsed with irrelevant peptide (Ctrl, at 10–6 M). Sixteen hours after the start of the coculture, IFN-γ secretion was measured by ELISA. (C) Tetramer-positive cell populations were sorted from infusion TILs and expanded using OKT3. Ten days after the start of the expansion, T cells were assessed for tetramer binding. (D) Bulk-treatment TILs for patient 3703 were analyzed for HLA-A*02:01/mutated epitope tetramer binding. The frequency of tetramer-positive cells (y axis) for each peptide screened (x axis) is indicated (left panel). A positive mutated epitope, NSDHL, was identified (middle panel), and a representative staining plot of 2 tetramer-positive cell populations is shown (right panel). (E) NSDHLhi and NSDHLlo cell populations were sorted and expanded, and 10 days after the start of the expansion, T cells were assessed for NSDHL-tetramer binding (left panels). Additionally, these sorted cell populations were assessed for CD4 and CD8 expression (middle panels). The NSDHLhi cell population, which consisted of 98% CD8+ T cells, and the NSDHLlo cell population, which consisted of 99% CD4+ T cells, were analyzed for peptide reactivity in coculture with T2 cells pulsed with titrated doses of the mutated NSDHL epitope. Sixteen hours after the start of the coculture, IFN-γ secretion was measured in the culture supernatant by ELISA (right panels). Results are representative of 2 independent experiments.

