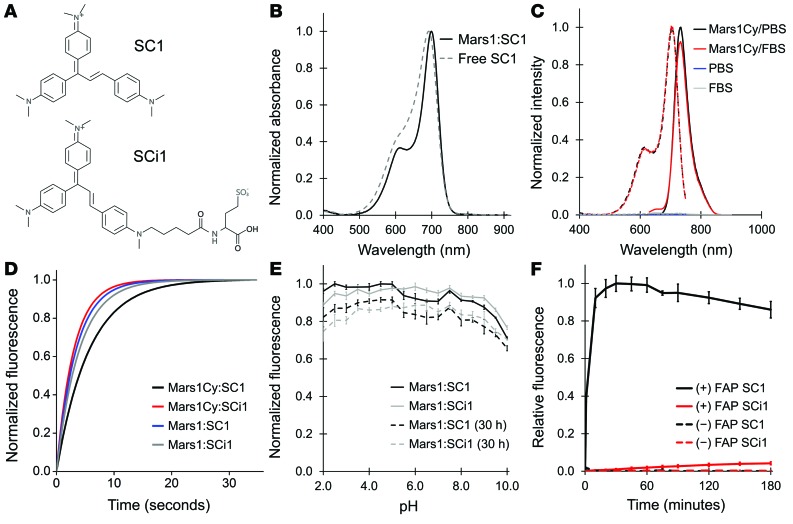
Figure 1. Properties of Mars1- and Mars1Cy-based fluoromodules.
(A) Chemical structures of fluorogens SC1 (membrane permeant) and SCi1 (membrane impermeant). (B) Absorbance spectra: SC1 in acidic (5% glacial acetic acid) methanol (mean, 4 samples) and Mars1:SC1 in PBS, pH 7.4 (mean, 2 samples); spectra are scaled to have peak absorbance of 1.0 units. Free and bound forms of SCi1 are similar but with a 3 nm bathochromic shift. (C) Excitation (dashes, mean of 5 samples) and emission (solid, mean of 4 samples) spectra of SCi1 in PBS and FBS with and without Mars1Cy; spectra of Mars1 and SC1 are virtually identical. Intensities are expressed as a fraction of the maximum signal. (D) Binding and fluorescence activation traces of Mars1:SC1, Mars1:SCi1, Mars1Cy:SC1, and Mars1Cy:SCi1 (1 acquisition per fluoromodule) recorded from solutions where [FAP] = KD and [fluorogen] = 10 KD. Respective on rates (3.3 × 10⁶, 2.8 × 10⁶, 3.7 × 10⁵, and 1.5 × 10⁶ M-1s-1) were calculated from activation observed at 4 different concentrations of fluorogen. (E) Fluorescence of Mars1 fluoromodules in buffers spanning pH 2.0 to 10.0 measured 1 and 30 hours after sample preparation. Points indicate mean sample fluorescence (n = 5: Mars1:SC1/1 hour, n = 4: others). Bars indicate SD. Values are scaled such that the highest mean signal is 1.0. Mars1Cy exhibits similar pH insensitivity. (F) Fluorescence from HEK293 cells that express cytoplasmic Mars1Cy-eGFP, and untransfected control cells maintained at 37°C prior to (0 minutes) and at intervals after addition of SC1 or SCi1. Points denote average of median population intensities (n = 3 separate samples prepared identically) analyzed by flow cytometry.

