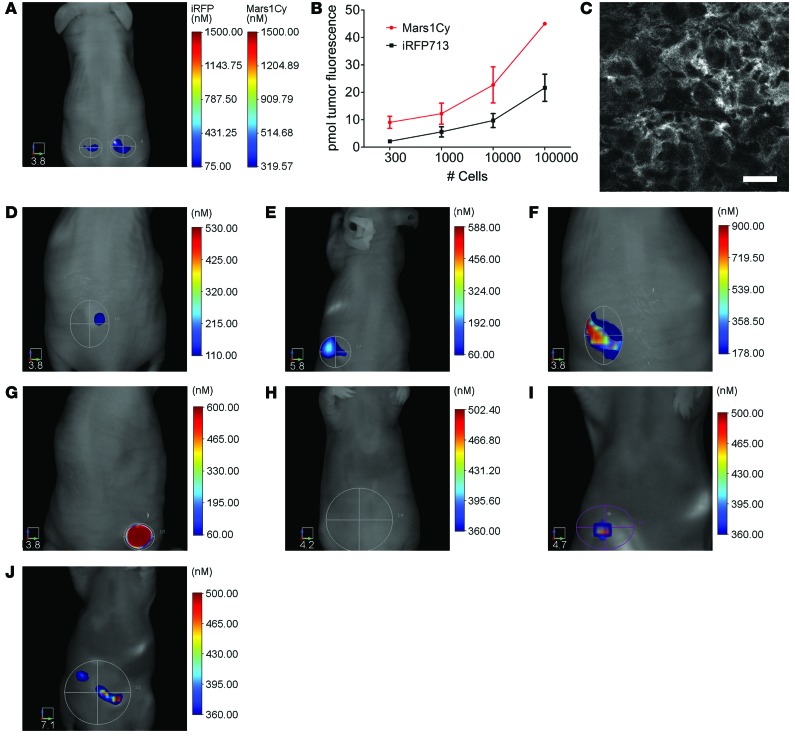
Figure 4. Application and quantitation of fluorescence from fluoromodules in living mice.
(A) Example of a nude mouse implanted with 300 cells of iRFP713-expressing HCT116 cells in the left flank and an equal number of Mars1Cy-expressing cells, prelabeled with SC1, in the right flank. Image is representative of data quantified in B. The fluoromodule-hosting cells used here express less protein than the cells hosting iRFP713 (Supplemental Figure 5). (B) Fluorescence measured from mice injected and imaged as described in A, using different numbers of cells. Points denote means; bars indicate SEM (n = 3: 1 × 10⁵ Mars1Cy-expressing cells, n = 4: others, total animals treated and imaged: 16). Analysis of the same data in terms of relative fluoromodule signal yields similar results (Supplemental Figure 6). (C) Fluorescence image of a tumor section (3.2 by 1.7 mm) composed of HCT116 cells that express Mars1Cy on the cell surface, labeled by SC1 given i.p. Scale bar: 16 μm. Field is near the center of the section. (D and E) s.c. FAP-bearing tumors that express Mars1Cy on the cell surface were labeled by SC1 (400 nM final) administered i.p. and i.v. (tail vein), respectively. (F and G) s.c. tumors as in D and E were labeled with SCi1 (400 nM final), injected i.p. or i.v., respectively. (H) i.p. injection of SC1 produces no significant background signal when FAP-bearing cells are not present. (I and J) Mars1Cy-bearing tumors can be imaged in the i.p. cavity of mice after delivery of SC1 or SCi1, respectively, via i.p. injection. Data presented in C–J represent results obtained from 3 samples/animals. Scales in mouse images are given in millimeters.

